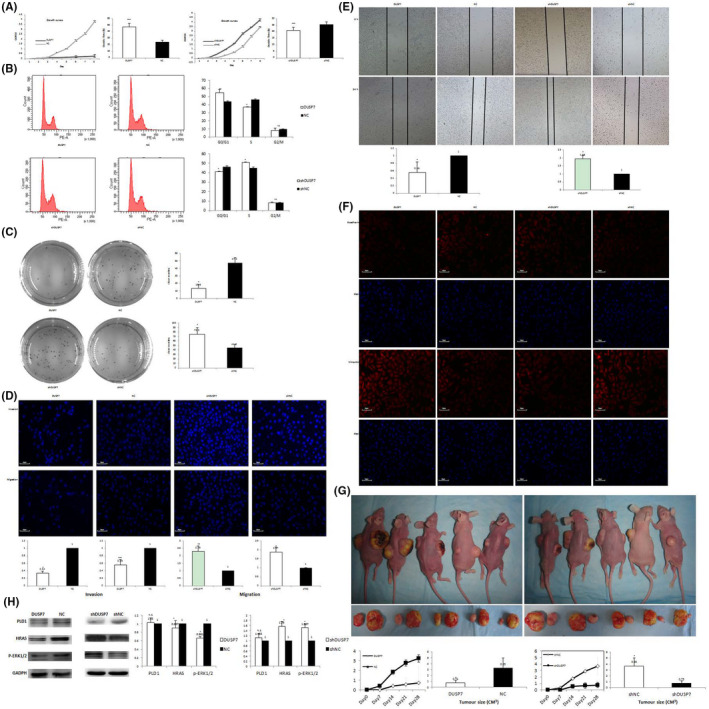
FIGURE 3.

The effect of DUSP7 on the biological function of SIHA cells. The CCK‐8 assay growth curves showed that DUSP7‐SIHA cells proliferated significantly slower than NC‐SIHA cells, based on a clear delay in the doubling time (47.72 ± 1.14 h vs. 23.99 ± 0.47 h, p = 0.0001; Figure 3A). Cell cycle analysis indicated that the DUSP7‐SIHA cells displayed a concomitant decrease in the percentage of cells in S phase (37.71 ± 0.53% vs. 46.96 ± 0.59%, p < 0.0001) and a significant increase in the percentage of cells in G0/G1 phase (52.50 ± 3.49% vs. 44.04 ± 0.71%, p = 0.0473; Figure 3B). Colony formation assays showed that the number of colonies formed by DUSP7‐SIHA cells was significantly less than that formed by NC‐SIHA cells (44.67 ± 9.0 vs. 75.33 ± 14.47, p = 0.0121; Figure 3C). In the Matrigel invasion/migration assay, DUSP7‐SIHA cells demonstrated a significantly weaker ability to invade (0.34 ± 0.05 vs.1, p = 0.0207; Figure 3D; optical magnification*20) and migrate (0.56 ± 0.14 vs.1, p = 0.0059) through the membrane than control cells. Wound‐healing assays showed that the migration area of DUSP7‐SIHA cells was significantly smaller than that of NC‐SIHA cells (0.55 ± 0.03 vs.1, p = 0.049; Figure 3E). E‐cadherin expression was significantly increased, but vimentin expression was significantly reduced in DUSP7‐SIHA cells (Figure 3F). In contrast, the results of CCK‐8 assay growth curves indicated that the doubling time of shDUSP7‐SIHA cells was significantly shorter than that of shNC‐SIHA cells (49.12 ± 1.14 h vs. 64.14 ± 0.47 h, p = 0.0001; Figure 3A). Cell cycle analysis indicated that shDUSP7‐SIHA cells displayed a concomitant increase in the percentage of cells in S phase (49.54 ± 1.53% vs. 46.4 ± 0.97%, p = 0.019) and a significant decrease in the percentage of cells in G0/G1 phase (41.8 ± 0.38% vs. 45.2 ± 0.80%, p = 0.020; Figure 3B). Colony formation assays showed that the number of colonies formed by shDUSP7‐SIHA cells was significantly greater than that formed by shNC‐SIHA cells (13.33 ± 3.4 vs. 30.33 ± 16.50, p = 0.049; Figure 3C). In the Matrigel invasion/migration assay, DUSP7‐SIHA cells demonstrated a significantly weaker ability to invade (2.29 ± 0.38 vs. 1, p = 0.0007; Figure 3D) and migrate (1.87 ± 0.28 vs.1, p = 0.0426) through the membrane than control cells (p = 0.0207 and 0.0059, respectively; Figure 3D). Wound‐healing assays showed that the migration area of shDUSP7‐SIHA cells was larger than that of shNC‐SIHA cells (1.95 ± 0.19 vs.1, p = 0.0313; Figure 3E). E‐cadherin expression was significantly reduced, while vimentin expression was increased, in shDUSP7‐SIHA cells (Figure 3F; optical magnification*20). After subcutaneous injection, DUSP7‐SIHA tumours were observed much later than NC‐SIHA tumours (13 ± 4 vs 6 ± 1 days; p = 0.0122; Figure 3G). On the study end date, the DUSP7‐SIHA tumours were significantly smaller than the NC‐SIHA tumours (0.74 ± 0.38 vs 3.25 ± 1.68 cm3; p = 0.0183). In contrast, the shDUSP7‐SIHA tumours were observed much earlier than the shNC‐SIHA tumours (7 ± 1 vs 12 ± 2 days; p = 0.0303). On the study end date, the shDUSP7‐SIHA tumours were significantly larger than the shNC‐SIHA tumours (3.66 ± 1.33 vs 0.75 ± 0.41 cm3; p = 0.0201). The expression of HRAS and p‐ERK1/2 was decreased in DUSP7‐SIHA cells compared with NC‐SIHA cells (p = 0.0003 and 0.0026, respectively; Figure 3H). In contrast, the expression of HRAS and p‐ERK1/2 was significantly upregulated in shDUSP7‐SIHA cells compared with control cells (p = 0.034 and 0.0026, respectively). The difference in the expression level of PLD1 between the two cell groups was not statistically significant (p = 0.0947 and 0.307, respectively)
