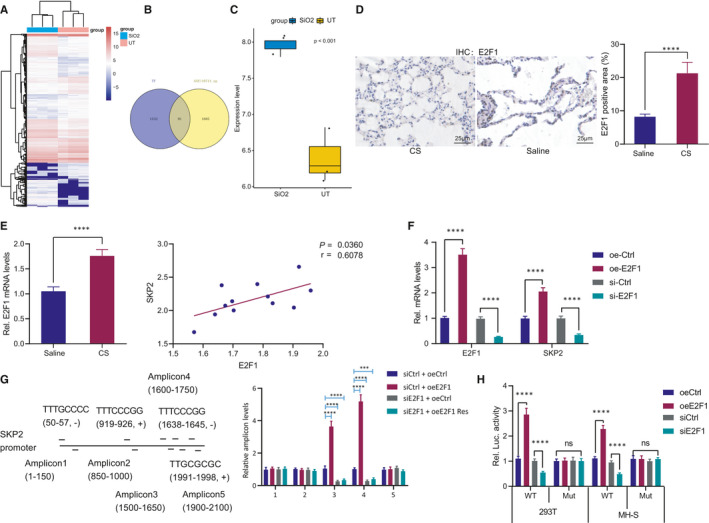
FIGURE 4.

E2F1 is a transcription factor of SKP2. (A) Heat map of differentially expressed genes in microarray data set GSE110711 of mice with silicosis, with SiO2 representing silicosis model and UT representing the control. (B) The intersection of the gene upregulated in microarray data set GSE110711 and 1623 mouse transcription factors obtained from AnimalTFDB. (C) Expression pattern of E2F1 in microarray data set GSE110711. (D) IHC analysis of E2F1 in alveolar tissues of mouse models. (E) RT‐qPCR analysis of E2F1 in alveolar tissues of mouse models, and correlation between E2F1 and SKP2 expression pattern. (F) Detection of E2F1 and SKP2 mRNA level after MH‐S cells transfected with E2F1 overexpression vector or siRNA. (G) Five pairs of amplicons were designed for binding site of E2F1 on the SKP2 promoter based on MotifMap, followed by detection of amplicon binding after transfection of siE2F1 or oeE2F1 vector with mutant binding site in MH‐S cells. (H) Detection of the luciferase activity after co‐transfection of luciferase reporter gene vector and siE2F1 or oeE2F1 in 293T and MH‐S cells. *p < 0.05 vs. alveolar tissues in mice treated with saline (panel D); **p < 0.01 vs. MH‐S cells treated with siCtrl (panels F) or 293T/MH‐S cells treated with siCtrl (panel H); and ***p < 0.001 vs. normal mice (UT) (panel C), mice treated with saline (panel E), MH‐S cells treated with oeCtrl/siCtrl (panel F), MH‐S cells treated with siCtrl +oeCtrl (panel G) or 293T/MH‐S cells treated with oeCtrl (panel H); n.s., no significance. Measurement data were analysed by unpaired t test between two groups. Correlation between two parameters was determined by Pearson correlation. The experiment was conducted 3 times independently
