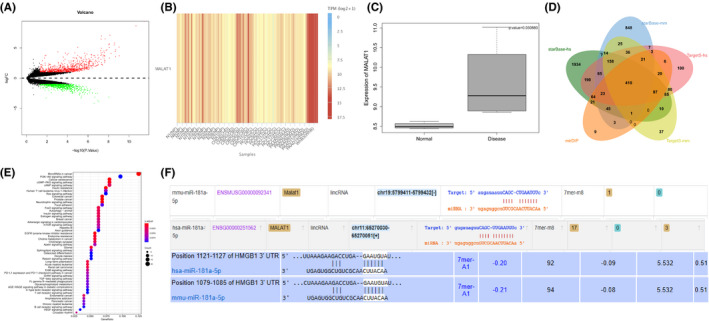
FIGURE 1.

The expression and binding relationship of MALAT1/miR‐181a‐5p/HMGB axis in AP samples. A, Volcano map of differentially expressed genes in AP‐related microarray data set GSE121038. The abscissa represents log 10pvalue, and the ordinate represents log FC. The red points in the Figure represent the significantly upregulated genes in AP, and the green points represent the significantly downregulated genes in AP. B, Expression of MALAT1 in EVs. The abscissa indicates the source of the EVs, and the histogram on the right is the colour scale (NP, normal person; CHD, coronary heart disease; CRC, colorectal cancer; HCC, hepatocellular carcinoma; PAAD, pancreatic adenocarcinoma; WhB, whole blood). C, Expression of MALAT1 in the microarray data set GSE121038. The abscissa represents the sample type, and the ordinate represents the expression value. The left box plot represents normal samples, and the right box plot represents disease samples. The upper right corner is the differential p value. D, Prediction of target genes of miR‐181a‐5p. The five ellipses in the Figure represent the prediction results of target genes in humans and mouse using starBase and TargetScan databases, and the prediction results of target genes in humans using the mirDIP database. The middle part represents the intersection of five sets of data. E, KEGG pathway enrichment analysis of candidate target genes, wherein the abscissa represents GeneRatio, and the ordinate represents the KEGG entry. The size of the circle in the Figure represents the number of enriched genes in the entry, the colour indicates p value of the enrichment, and the histogram on the right is the colour scale. F, Binding site information of MALAT1, miR‐181a‐5p and HMGB1 in humans and mice
