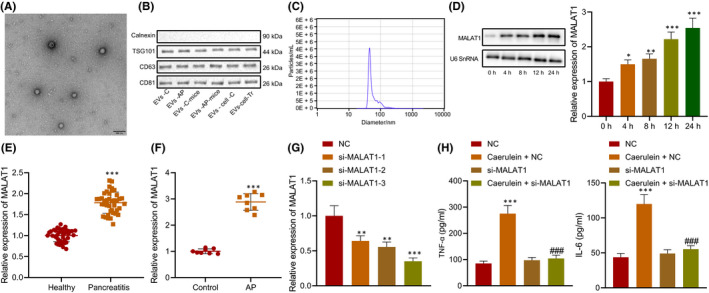
FIGURE 2.

Highly expressed MALAT1 in MPC‐83 cell‐derived EVs and EVs from serum of AP patients. A, EVs in serum and cell supernatant detected by TEM. B, Expression of EV markers, calnexin (EVs‐negative), TSG‐101, CD63 and CD81 (EVs‐positive) measured by Western blot analysis. C, Particle size of EVs analysed by NTA. D, MALAT1 expression in MPC‐83 cells determined using RT‐qPCR and Northern blot analysis. E, MALAT1 expression in the serum of AP patients and healthy normal people (n = 40) determined using RT‐qPCR. F, MALAT1 expression in the serum of AP mice and normal mice (n = 8) determined using RT‐qPCR. G, MALAT1 interference efficiency detected by RT‐qPCR. H, Levels of IL‐6 and TNF‐α in the MPC‐83 cells treated with si‐MALAT1. * vs. 0 h, healthy normal people, normal mice or MPC‐83 cells treated with NC. # vs. MPC‐83 cells treated with si‐MALAT1. * or # p < 0.05. ** or ## p < 0.01. *** or ### p < 0.001. Data are expressed as the mean ± standard errors
