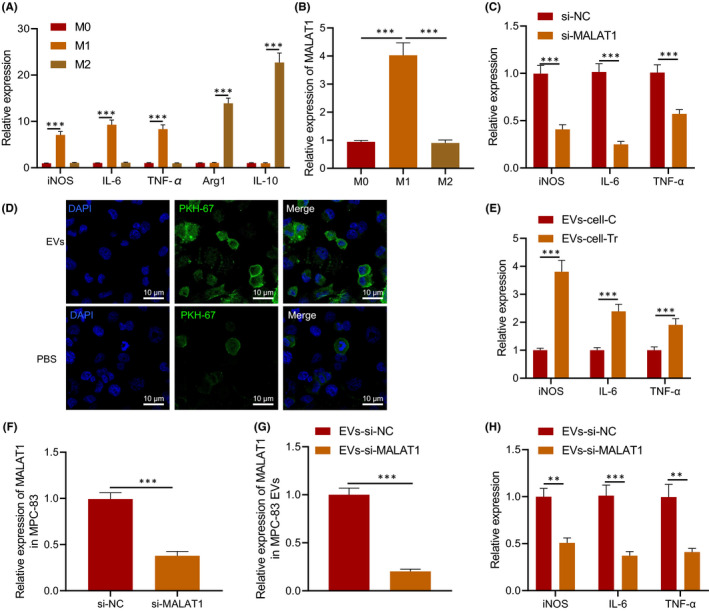
FIGURE 3.

EV‐encapsulated MALAT1 enhanced the M1 polarization of macrophages. A, The levels of related factors in M0, M1 and M2 macrophages determined using RT‐qPCR. B, MALAT1 in macrophages determined using RT‐qPCR. RAW264.7 monocytes were transduced with si‐MALAT1. C, Levels of iNOS, IL‐6 and TNF‐α in RAW264.7 cells determined using RT‐qPCR. D, Uptake of EVs by RAW264.7 cells. PKH67‐labelled EVs are green fluorescence, and DAPI‐stained nucleus is blue fluorescence, scale bar = 10 μm. RAW264.7 cells were co‐cultured with EVs extracted from caerulein‐treated MPC‐83 cells. E, Levels of M1 markers in RAW264.7 cells. MPC‐83 cells were transduced with si‐MALAT1. F, MALAT1 expression in MPC‐83 cells determined using RT‐qPCR. G, Expression of EVs‐secreted MALAT1 in MPC‐83 cells determined using RT‐qPCR. H, Levels of M1 markers detected in RAW264.7 cells co‐treated with MPC‐83 cells. * p < 0.05. ** p < 0.01. *** p < 0.001. Data are shown as the mean ± standard errors
