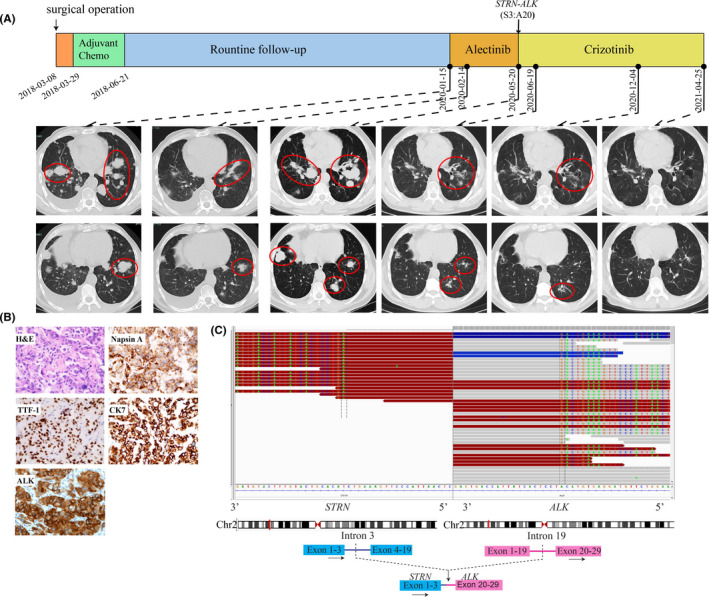
FIGURE 1.

Schematic of treatment history and NGS‐detected ALK fusion of Case 1. (A) The timeline of treatment and CT scans are showed where the red circles highlight the location of tumours. The time point of surgery and NGS test are labelled above. (B) Pathological examination of the surgical specimen. IHC testing (400×) results showed positive expression of Napsin A, TTF‐1, CK7 and ALK. (C) Identification of the STRN‐ALK fusion. Sequencing reads of ALK and STRN are visualized by the Integrative Genomics Viewers (IGV, top panel). The schematic below shows the fused exons of the STRN‐ALK rearrangement
