
FIGURE 5.
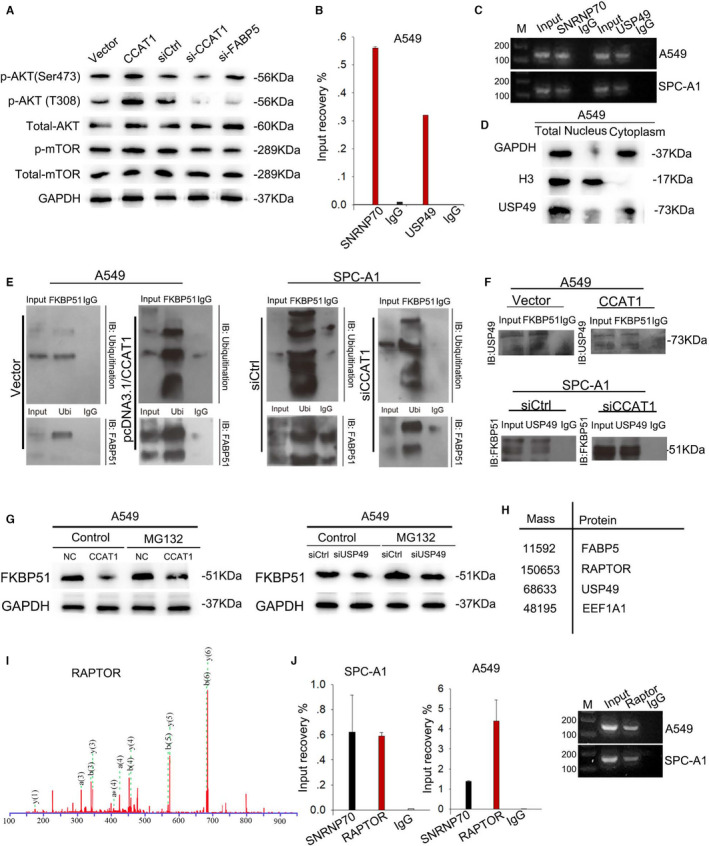
CCAT1 activated and stabilized mTOR pathway through competitively binding USP49 (A) Western blot was used to detect the level of p‐AKT (T308), p‐AKT (Ser473), total‐AKT, p‐mTOR and total‐mTOR in response to CCAT1 dysregulation. (B) RIP assay confirmed the interaction between CCAT1 and USP49. Results analysed by one‐way ANOVA. (C) qPCR results showed the enriched expression of CCAT1 on USP9‐binding complex. (D) Western blot revealed the predominant expression of USP49 in cytoplasm. (E) CoIP assay validated the effect of CCAT1 on FKBP51 ubiquitination. (F) CoIP assay was conducted to examine the interaction between FKBP51 and USP49 under the dysregulation of CCAT1. (G) Western blot was carried out to assess the effect of CCAT1 on the protein level of FKBP51. (H) Mass spectrometry analysis identified RAPTOR as a binding partner with CCAT1. (I) Mass spectrum peak of RAPTOR (J) RIP‐qPCR analysis was used to confirm the interaction between CCAT1 and RAPTOR. Results analysed by one‐way ANOVA. Three biological replicates each group for all experiments