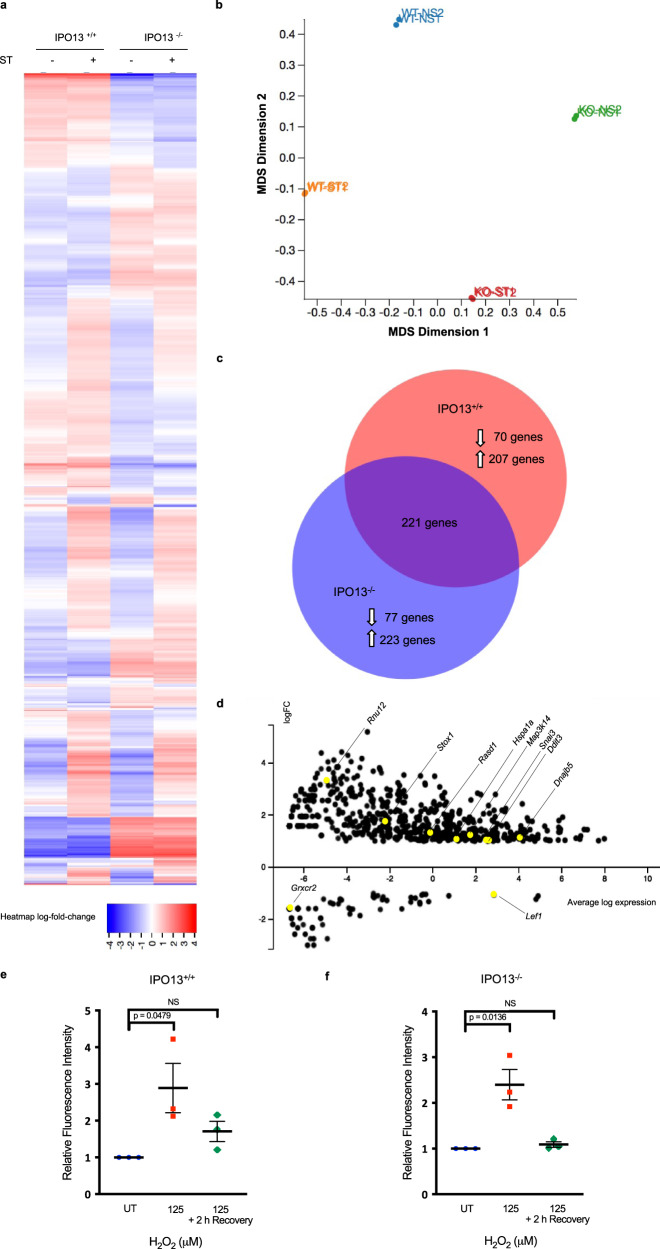
Fig. 1. The IPO13-dependent transcriptome in oxidative stress.
a Heat-map of transcript data for IPO13+/+ and IPO13−/− mESCs with or without treatment with 125 μM hydrogen peroxide (H2O2) for 1 h followed by 2 h recovery (ST; stress treated). Log2-fold differences in expression across the four data sets (FDR cut-off = 0.05) are shown for 2352 gene models (horizontal axis). b Multi-dimensional scaling (MDS) plot summarizing gene expression profiles of IPO13+/+ (“WT”) and IPO13−/− (“KO”) ESCs for control (NS; no stress) and oxidative stress-treated (ST) conditions. c Venn diagram for the differentially expressed genes in response to stress in IPO13+/+ and IPO13−/− ESCs (498 and 521 genes, respectively). d MA plot showing differentially expressed genes with a log2-fold change increase or decrease in expression (FDR cut-off = 0.05) in response to oxidative stress compared to untreated ESCs. Log fold change (logFC) values are plotted against log expression values (standardized read counts). Genes highlighted in yellow were selected for validation. e–f IPO13+/+ and IPO13−/− ESCs were treated with 125 µM H2O2 as indicated for 1 h and then stained for 30 min with 5 µM CellROX Green either immediately, or after a 2 h recovery period, and then analysed by flow cytometry. Quantification of the median fluorescence intensity relative to the untreated (UT) sample are shown representing the mean ± SEM (n = 3 independent experiments); p values (two-tailed student’s t-test) top to bottom left to right: p = 0.0617, p = 0.0479, p = 0.2167, and p = 0.0136. Source data are provided as a Source Data file.

