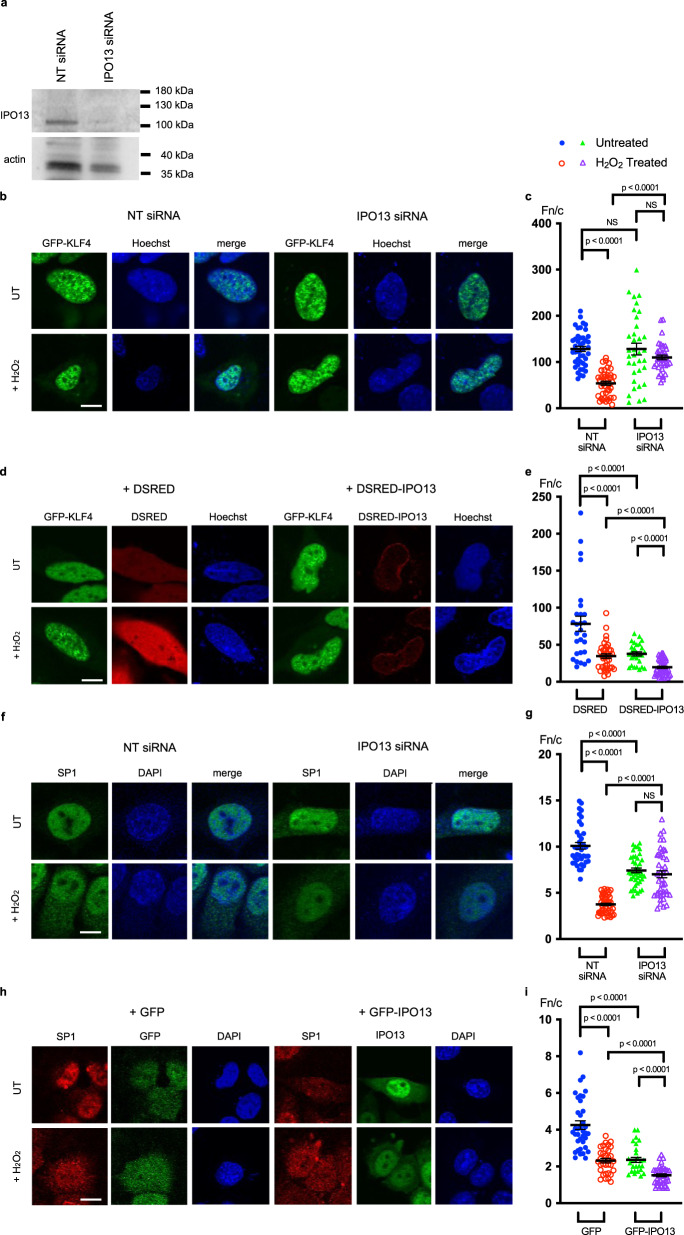
Fig. 5. IPO13 can mediate nuclear import and export of KLF4 and SP1 respectively in response to H2O2- induced oxidative stress.
a–c HeLa cells were transfected with non-targeting (NT) or IPO13 targeting siRNA 72 h prior to treatment with 125 μM H2O2 for 1 h. Cells were transfected to express GFP-KLF4 and processed for CLSM imaging and/or Western analysis. Cells were stained with Hoechst to highlight nuclei. a Total cell extracts were subjected to Western analysis using rabbit-anti-IPO13 (Protein Tech), with mouse-anti-actin (Abcam) as a control, and imaged using the ChemiDoc Gel Imaging System (Biorad). b Representative images of cells transfected to express GFP-KLF4. Scale bar = 10 μm. c Quantitative analysis of ectopic KLF4 protein localisation was carried out using the ImageJ software on images such as those in (a) to determine the nuclear to cytoplasmic ratio (Fn/c). Data represent the mean ± SEM for 44 cells (NT Untreated (UT)), 41 cells (NT+H2O2 Treated), 35 cells (IPO13 siRNA UT), and 37 cells (IPO13 siRNA + H2O2 treated) respectively for the nuclear (Fn) and cytoplasmic fluorescence (Fc) above background fluorescence. p values (two-tailed student’s t-test) top to bottom: p < 0.0001, p = 0.1789, p = 0.9899, and p < 0.0001. d–e HeLa cells were co-transfected to express either DSRED or DSRED-tagged IPO13 with GFP-KLF4 and treated for 1 h ± 125 μM H2O2 prior to CLSM imaging. Cells were stained with Hoechst to highlight nuclei. d Representative images of cells co-expressing DSRED or DSRED-IPO13 with GFP-KLF4. Scale bar = 10 μm e. Quantitative analysis of ectopic KLF4 protein localisation performed as per (c). Data represent the mean ± SEM for 28 cells (DSRED UT), 38 cells (DSRED + H2O2 Treated), 27 cells (DSRED-IPO13 + UT) and 44 cells (DSRED-IPO13 + H2O2 Treated). p values (two-tailed student’s t-test) top to bottom: p < 0.0001, p < 0.0001, p < 0.0001, and p < 0.0001. f–g HeLa cells were transfected with siRNA as in a–c. prior to treatment with 125 μM H2O2 for 1 h. Cells immediately processed for CLSM imaging and immunostained with anti-SP1. f Representative images of cells immunostained with anti-SP1. Scale bar = 10 μm g. Quantitative analysis of endogenous SP1 localisation carried out as per (c). Data represent the mean ± SEM for 39 cells (NT UT), 47 cells (NT + H2O2 Treated), 41 cells (IPO13 siRNA UT), and 43 cells (IPO13 siRNA + H2O2 Treated). p values (two-tailed student’s t-test) top to bottom: p < 0.0001, p < 0.0001, p < 0.0001, and p = 0.2018. h–i HeLa cells were co-transfected to express either GFP or GFP-tagged IPO13 and treated for 1 h ± 125 μM H2O2 prior to immunostaining using anti-SP1 antibody. h Representative images of cells immunostained with anti-SP1. Scale bar = 10 μm. i Quantitative analysis of endogenous SP1 localisation carried out as in (c). Data represent the mean ± SEM for 37 cells (GFP UT), 32 cells (GFP + H2O2 Treated), 29 cells (GFP-IPO13 UT), and 38 cells (GFP-IPO13 + H2O2 Treated). p values (two-tailed student’s t-test) top to bottom: p < 0.0001, p < 0.0001, p < 0.0001 and p < 0.0001. Source data are provided as a Source Data file.

