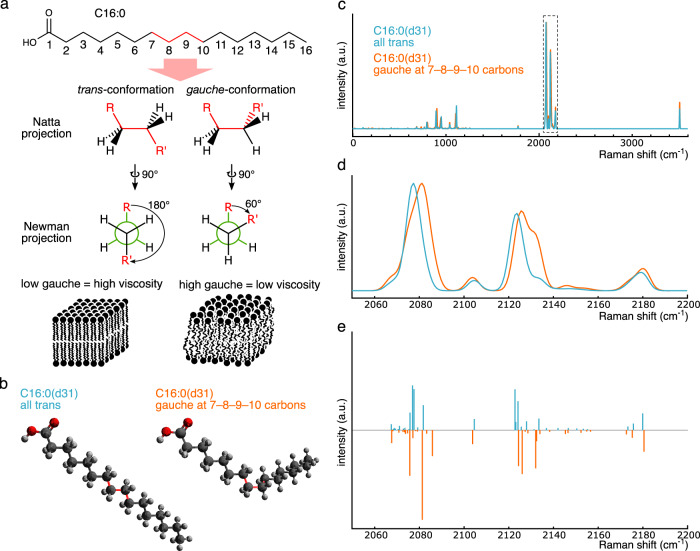
Fig. 2. Gauche/trans conformation affects the spectra of C–D vibration.
a Schematic image of gauche/trans conformation and membrane viscosity. Gauche/trans conformation is shown with Natta and Newman projections. Lipid bilayers with a lower (left) and higher (right) gauche/trans ratio have higher and lower viscosity, respectively. The numbering of carbon atoms in C16:0 is displayed in the skeletal formula. b Structures of C16:0(d31) with all trans (left) and one gauche conformation at 7–8–9–10 consecutive carbons (right). Dark gray, light gray, and red atoms represent carbon, deuterium, and oxygen atoms, respectively. Chemical bonds between four consecutive carbon atoms corresponding to the skeletal formula in (a) are shown in red. c Raman spectra simulated using DFT. Magnified view of the dashed box and its corresponding Raman activity are shown in (d) and (e), respectively. The intensity was normalized by equalizing prominent peak heights of the C–D vibration region. Graphs (d) and (e) are also shown in Fig. S2a, b.

