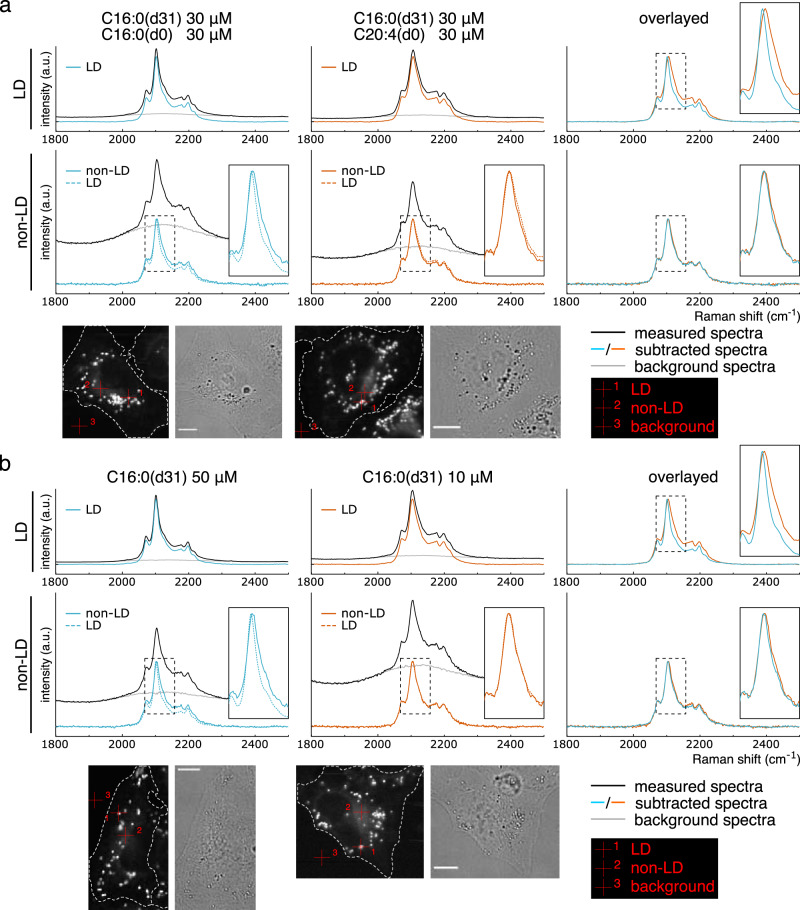
Fig. 3. Spectral transitions of C16:0(d31) in HeLa cells.
a, b HeLa cells were treated with indicated concentrations of fatty acids or a fatty acid mixture, and the representative Raman spectra from C–D vibration were compared at LD and non-LD regions. Background spectra (gray lines) were subtracted from each measured spectrum (black lines) with the appropriate weightings (see Methods section for details) to illustrate a clear comparison, thus, producing subtracted spectra (solid blue or orange lines). Spectra from LD regions are also displayed with those from non-LD regions using dashed blue or orange lines at the bottom-left and bottom-middle graphs. Magnified views of the dashed black boxes are shown in the inset of some graphs. Pixels of representative LD regions, non-LD regions, and pixels used for background spectra are represented by red crosshairs 1, 2, and 3, respectively, in the bottom images. Two independent experiments confirmed the results. Scale bars indicate 10 μm.

