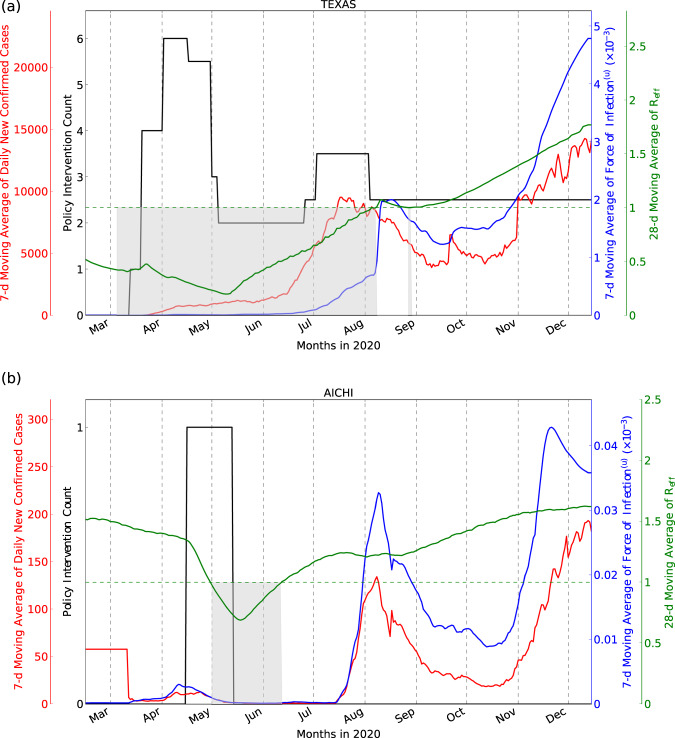
Fig. 6. Model outputs.
New daily confirmed cases, number of NPIs, F(u) and Reff for Texas, USA (a) and Aichi, Japan (b), chosen to represent a location with high and low COVID-19 associated deaths, respectively. Seven-day moving average of the daily confirmed case counts and number of Non-Pharmaceutical Interventions (NPIs) are plotted on the left y axis, and the 7-day moving average of F(u) (see Eq. (11)) and the 28-day moving average of Reff (see Eq. (13)) are plotted on the right y axis. For Reff < 1 (shaded gray regions below the horizontal dotted line), dynamics are tending toward the Disease-Free Equilibrium (DFE)118. These areas often overlap with the dates when multiple NPIs are imposed.

