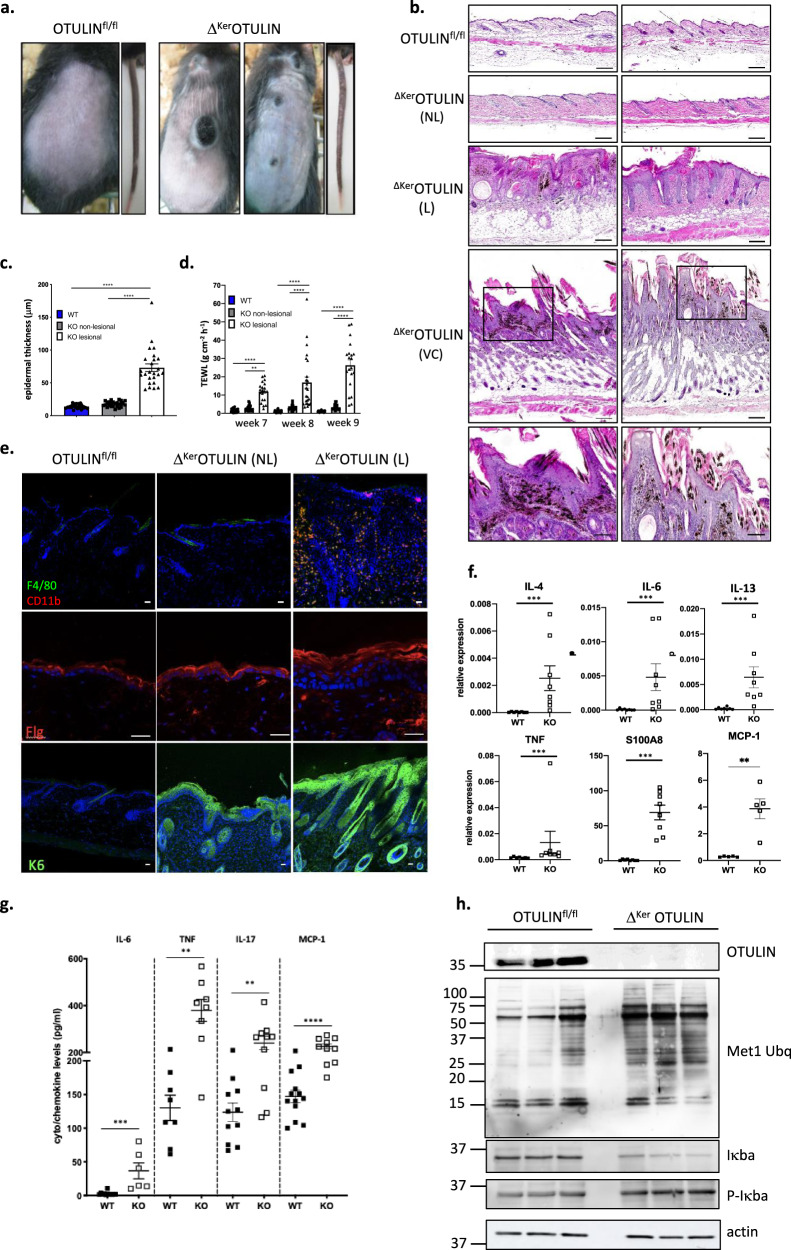
Fig. 1. ΔKerOTULIN mice exhibit delineated inflammatory skin lesions that develop into verrucous carcinomas.
a Representative images of the back skin and tail of 7-week old OTULINfl/fl and ΔKerOTULIN mice. b Representative images of H&E-stained skin sections of 7-week old mice of the indicated genotypes. Scale bar: 100 μm. The two lower panels show verrucous carcinomas in 11-week old ΔKerOTULIN mice. Boxed area depicts magnified area shown below. Scale bar for magnified areas: 200 μm. NL non-lesional; L lesional; VC verrucous carcinoma. c Epidermal thickness quantification at 7 weeks of age (n = 5 per condition; ****p < 0.0001, One-way ANOVA with multiple comparisons). Data represent means ± SEM. d Trans-epidermal water loss (TEWL) measurements at week 7, 8 and 9 of age (n = 5 mice per condition; **p = 0.0019; ****p < 0.0001, One-way ANOVA with multiple comparisons). Data represent means ± SEM. e Immunofluorescent staining of skin sections from 7-week old OTULINfl/fl mice and non-lesional (NL) and lesional (L) skin of ΔKerOTULIN mice with antibodies against CD11b (red) and F4/80 (green) (upper panel), filaggrin (middle panel) or keratin-6 (lower panel) and nuclear staining with Dapi. Each staining was performed on n = 5 mice per condition. Scale bar: 25 μm. f Relative mRNA expression of IL-4, IL-6, IL-13, TNF, S100A8, and MCP-1 in epidermal tail lysates of 8-weeks-old OTULINfl/fl (WT; n = 8 and n = 5 for MCP-1 analysis) and ΔKerOTULIN (KO; n = 8) mice. Data represent means ± SEM. (***p < 0.001; Mann−Whitney two-sided testing). g Levels of IL-6, TNF, IL-17, and MCP-1 in serum of 8-weeks-old OTULINfl/fl (WT; n ≥ 7) and ΔKerOTULIN (KO; n = 8) mice (**p < 0.01; ***p < 0.001; ****p < 0.0001; Mann−Whitney two-sided testing was performed between relevant genotypes). h Western blotting on epidermal tail lysates of 7-week old OTULINfl/fl (n = 3) and ΔKerOTULIN (n = 3) mice using antibodies detecting OTULIN, linear ubiquitin chains (M1-Ubq), IκBα, and phospho-IκBα. Immunoblotting for phospho-IκBα and consecutively for IκBα was performed on the same blot. Molecular weight marker units are in kilodalton (kD). Anti-actin is shown as loading control. The representative image is shown for three independent experiments.

