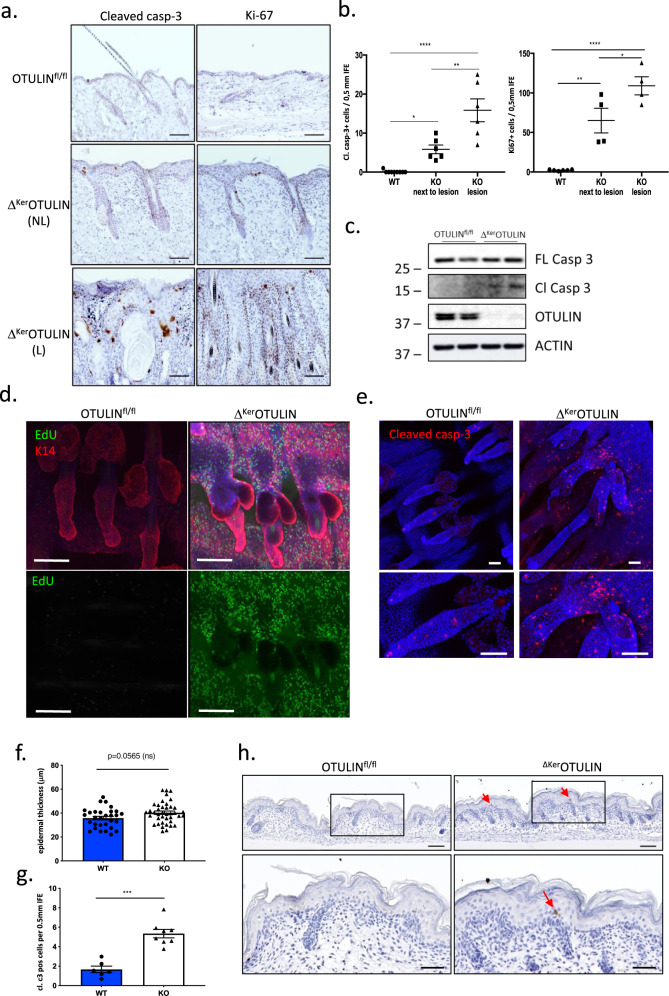
Fig. 2. Epidermis of ΔKerOTULIN mice exhibits hyperproliferation and enhanced apoptosis.
a Skin sections of 7-week old OTULINfl/fl and ΔKerOTULIN mice stained with antibodies against cleaved caspase-3 and Ki-67 to assess apoptosis and proliferation, respectively. NL non lesional; L lesional. Scale bar: 200 μm. b Quantification of the number of interfollicular epidermis (IFE) cells from 7-week old OTULINfl/fl (WT) and ΔKerOTULIN (KO) mice that stain positive for cleaved caspase-3 and Ki-67 (n = 9 WT mice; n = 6 and 4 KO non-lesional mice per condition; n = 6 and 4 KO lesional mice; One-way ANOVA; *p < 0.5; **p < 0.01; ****p < 0.0001). Data represent means ± SEM. c Western blot analysis for expression of full-length (FL) and cleaved (Cl) caspase-3 in epidermal tail lysates from OTULINfl/fl and ΔKerOTULIN mice. Anti-actin immunoblotting was used as a loading control. Molecular weight marker units are in kilodalton (kD). This experiment was repeated three times independently with similar results. d EdU (green) retaining cells in tail wholemount sections of 7-week old OTULINfl/fl and ΔKerOTULIN mice after 3 h chase. Wholemounts were stained for Keratin-14 (K14; red) and counterstained with Dapi (blue). Scale bars: 100 μm. Lower panels show EdU staining only. This experiment was repeated three times independently with similar results. e Tail wholemount sections of 7-week old OTULINfl/fl and ΔKerOTULIN mice stained for cleaved caspase-3 (red) and counterstained with Dapi. Lower panels depict magnified views. Eight mice per genotype were analyzed. Scale bars: 50 μm. f, g Quantification of epidermal thickness (f) and the number of cleaved caspase-3-positive cells (g) in the IFE of skin sections of P0.5 control and ΔKerOTULIN pups (WT: n = 3; KO: n = 4; Mann−Whitney two-sided test; ***p = 0.0007). Data represent means ± SEM. h Representative images of cleaved capase-3-stained skin sections of OTULINfl/fl and ΔKerOTULIN pups. Eight mice per genotype were analyzed. Arrows indicate apoptotic IFE cells. Lower panels depict magnified views of the boxed areas. Scale bars: 100 μm.

