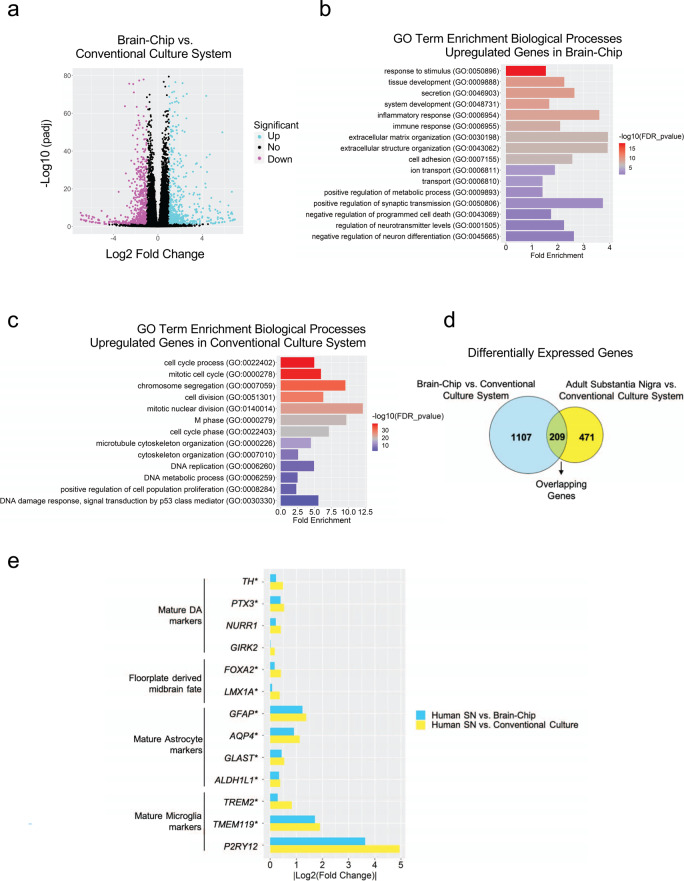
Fig. 2. Differentially Expressed (DE) genes and enriched gene ontology categories in Substantia Nigra Brain-Chip or conventional cell cultures as compared to the adult substantia nigra.
a The volcano plot resulted by the differentially gene expression (DGE) analysis between Substantia Nigra Brain-Chip and conventional cell cultures. For the selection of the DE genes we used the following thresholds: adjusted (adj) p-value < 0.05 and |Log2(foldchange)| >1. The identified up- (down-) regulated genes are highlighted in cyan (magenta) color respectively. Sample sizes were as follows: Substantia Nigra Brain-Chip, n = 4, conventional cell culture system, n=4. The p-values attained by the two-sided Wald test and corrected for multiple testing using the Benjamini and Hochberg method. b, c List of biological processes identified by Gene Ontology (GO) enrichment analysis using the up- and downregulated genes respectively resulted by the differentially gene expression analysis between Substantia Nigra Brain-Chip and conventional cell cultures. d DGE analysis identified up- and downregulated genes in Substantia Nigra Brain-Chip compared to conventional cell cultures (cyan circle), and human adult substantia nigra compared to conventional cell cultures (yellow circle). Sample sizes were as follows: Substantia Nigra Brain-Chip, n = 4, Conventional cell culture system, n = 4, and adult substantia nigra, n = 8 (independent biological specimens). Culture in Brain-Chips and conventional cell cultures were done in parallel. Samples were collected and processed for analyses 8 days post-seeding (D8). e Gene expression pattern analysis between the following groups: i) Adult Substantia Nigra vs. Brain-Chip and ii) Adult Substantia Nigra vs. Conventional Cell Culture system. In the Brain-Chip, most of these genes (those with an asterisk) exhibit statistically significantly smaller fold changes (P < 0.05) in their expression levels as compared to the conventional cell culture system. Statistical analysis is two-sided Wald test and corrected for multiple testing using the Benjamini and Hochberg method. The adjusted P value per gene is contained in Supplementary Table 1.

