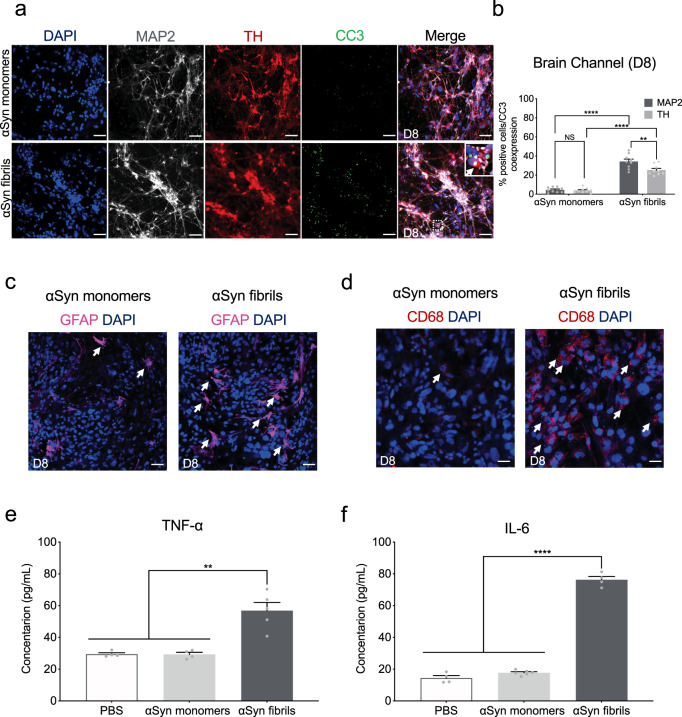
Fig. 5. αSyn-induced caspase-3 activation and neuroinflammation.
a Representative merged images showing immunostaining for microtubule-associated protein 2 (gray, MAP2), tyrosine hydroxylase (red, TH), and Cleaved Caspase-3 (green, CC3) in the brain channel at 6-days post-exposure to αSyn fibrils or αSyn monomers. Scale bars: 100 μm. b Quantitation of the number of CC3 and MAP2- or TH-positive neurons. Statistical analysis by two-way ANOVA with Tukey’s multiple comparisons test (3–4 randomly selected different areas per chip, n = 3 independent chips/experimental group, **P = 0.0033, ****P < 0.0001, NS not significant). Error bars represent mean ± SEM. Scale bars: 100 μm. c Immunostaining of the astrocyte marker glial fibrillary acidic protein (magenta, GFAP) demonstrated activation of astrocytes (white arrow) at day 6 post exposure to αSyn fibrils compared to monomeric αSyn. Scale bar, 100 μm. d Immunostaining of the microglial CD68 (red) demonstrated activation of microglia (white arrow) at day 6 post exposure to αSyn fibrils compared to monomeric αSyn. Scale bar, 100 μm. e The secreted levels of tumor necrosis factor-alpha (TNF-α) in the αSyn fibril model. Statistical analysis is two-sided unpaired t-test (n = 6–7 independent chips, **P = 0.0023). Error bars represent mean ± SEM. f The secreted levels of proinflammatory cytokine interleukin-6 (IL-6) in the αSyn fibril model. Statistical analysis is two-sided unpaired t-test (n = 4–7 independent chips, ****P < 0.0001). Error bars represent mean ± SEM.

