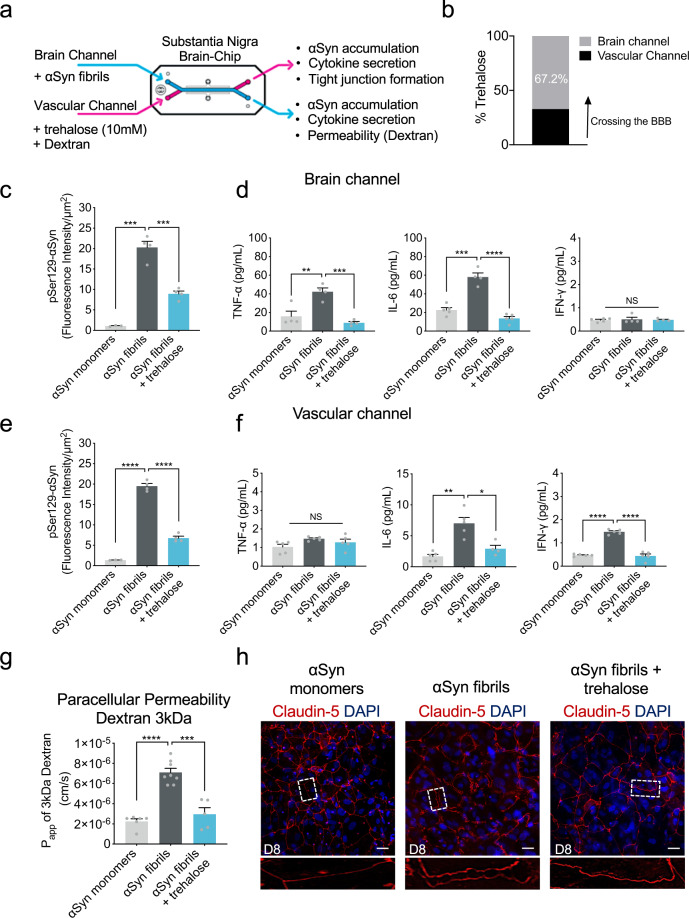
Fig. 7. Effect of autophagic inducer, trehalose on the αSyn induced model.
a Schematic of the experimental design for the perfusion of trehalose and αSyn fibril in the Brain-Chip. b Percentage of trehalose crossing the blood-brain barrier (BBB) after 24 h of perfusion. c Quantitation of the accumulated phosphorylated αSyn at the brain channel based on the fluorescence intensity at day 8 in the αSyn fibril model with or without trehalose treatment. Statistical analysis by two-way ANOVA with Tukey’s multiple comparisons test (n = 3–4 independent chips with 3–5 randomly selected different areas per chip, ***P = 0.001 compared to monomeric group, ***P = 0.0009 compared to αSyn fibrils). Error bars represent mean ± SEM. d Secreted levels of tumor necrosis factor-alpha (TNF-α), interleukin-6 (IL-6), and interferon gamma (IFN-γ) at the brain channel at D8. Statistical analysis by two-way ANOVA with Tukey’s multiple comparisons test (n = 4 independent chips with 3–5 randomly selected different areas per chip, TNF-α: **P = 0.0011 compared to monomeric group, ***P = 0.0003 compared to αSyn fibrils, IL-6: ***P = 0.0002 compared to monomeric group, ****P < 0.0001 compared to αSyn fibrils, NS not significant). Error bars represent mean ± SEM. e Quantitation of the accumulated phosphorylated αSyn at the vascular channel based on the fluorescence intensity at day 8 in the αSyn fibril model with or without trehalose treatment. Statistical analysis by two-way ANOVA with Tukey’s multiple comparisons test (n = 4 independent chips with 3–5 randomly selected different areas per chip, ****P < 0.0001). Error bars represent mean ± SEM. f Secreted levels of TNF-α, IL-6, and IFN-γ at the vascular channel at day 8 in the αSyn fibril model with or without trehalose treatment. Statistical analysis is two-way ANOVA with Tukey’s multiple comparisons test (n = 3–4 independent chips with 3–5 randomly selected different areas per chip, IL-6: **P = 0.0025 compared to monomeric group, *P = 0.0158 compared to αSyn fibrils, IFN-γ: ****P < 0.0001, NS not significant). Error bars represent mean ± SEM. g Quantitative barrier function analysis via permeability to 3 kDa fluorescent dextran at day 8 in the αSyn fibril model with or without trehalose treatment. Statistical analysis is two-sided unpaired t-test (n = 5–8 independent chips, ****P < 0.0001 compared to monomeric group, ***P = 0.0001 compared to αSyn fibrils). Error bars represent mean ± SEM. h Morphological analysis of tight junctions in endothelial cells at day 8 in the αSyn fibril model with or without trehalose treatment. The junction protein expression of Claudin-5 was visualized by immunofluorescence staining with a Claudin-5 antibody and DAPI for cell nuclei. Dashed boxes show the endothelial junctions. Scale bars: 50 μm.

