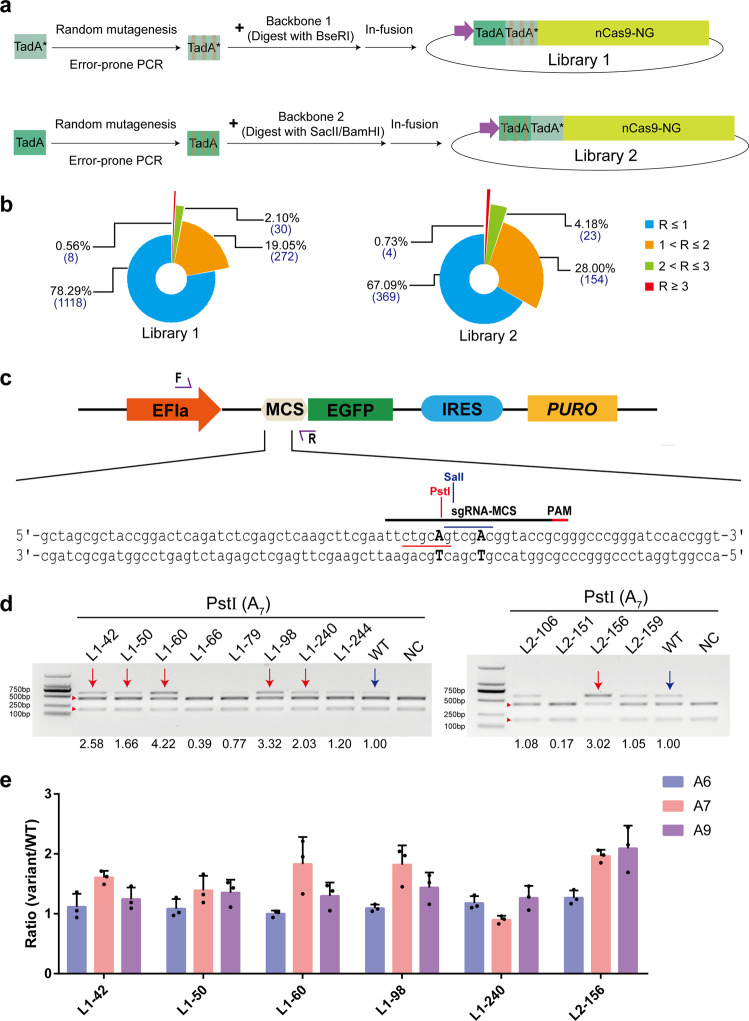
Fig. 2. Evolution of NG-ABEmax variants with improved A•T to G•C base editing activity.
a Scheme of libraries generation design. The library 1 contain TadA* mutations and the library 2 contain TadA mutations. Red lines represent the point mutations. b Summary of the library 1 and library 2 (A•T to G•C base editing efficiencies at A12). R represents the ratio of editing efficiency of mutants to NG-ABEmax. c Schematic for assessing A•T to G•C base editing efficiencies of NG-ABEmax variants using the HEK293-PME cell line. Restriction sites are highlighted in red and blue. d Agarose gel electrophoresis results of testing editing efficiency of NG-ABEmax variants with PstI. Cleaved bands from PstI are labeled with red triangle. The amplicon is 606-bp. The variants with high-activities are highlighted with red arrows. WT represents NG-ABEmax and highlighted with blue arrows. e Boosted editing efficiencies of selected variants via EGFP-based reporter system. Error bars indicate mean ± s.d. (n = 3 independent experiments). Source data are available in the Source data file.

