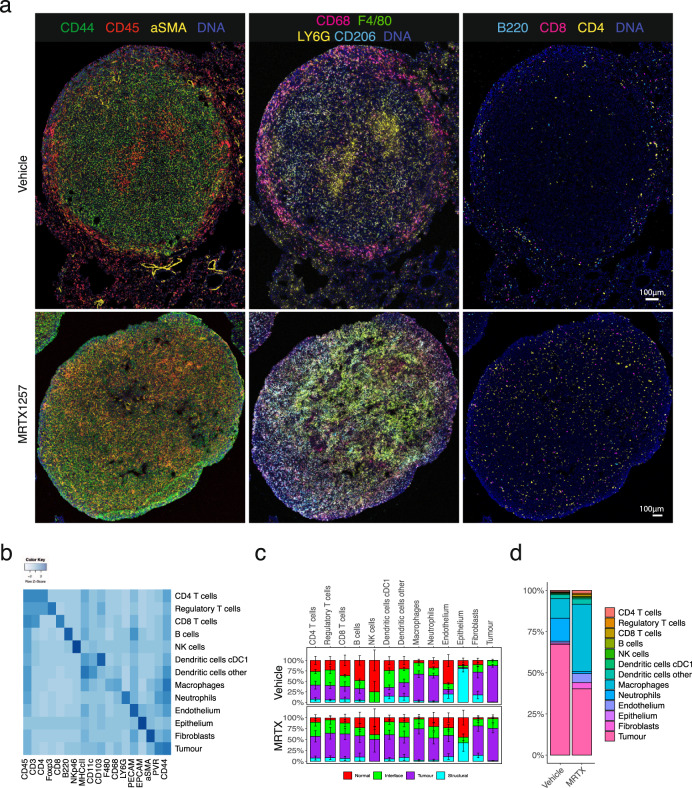
Fig. 3. Characterisation and spatial distribution of cell types in Lewis lung carcinoma model.
a Two representative 3LL lung tumours, either treated with vehicle or MTRX1257 for 7 days (n = 6 for both groups). Overall tissue organisation changes upon KRAS inhibition, with increased CD45+ leucocytes and αSMA+ fibroblasts in the tumour domain (left), increased expression of macrophage markers such as F4/80 and CD206 in the tumour (middle), and more T cells infiltrating the tumour bed (right). For visualisation purposes, the images were processed in Fiji with a median filter (radius 0.5). To enhance visualisation of the small lymphocytes, the channels for CD3, CD4, CD8 and B220 were filtered using a band pass Fast Fourier Transformation. b Heatmap showing the expression of 18 lineage markers within the 13 identified cell types. The heatmap was scaled by row to emphasise the key markers per cluster. c Relative distribution of cell types within the tissue domains, separated by the two treatments. It shows how the fibroblasts, lymphocytes, DCs and macrophages have increased presence in the tumour domain, while neutrophils have been reduced. Error bars indicate the standard error of the mean over the ROIs (n = 6 for each treatment group). For full statistics using mixed-effects model, see Supplementary Fig. 4. d Proportions of cell types within the tumour domain, separated by treatment. Abbreviations MRTX MRTX1257.

