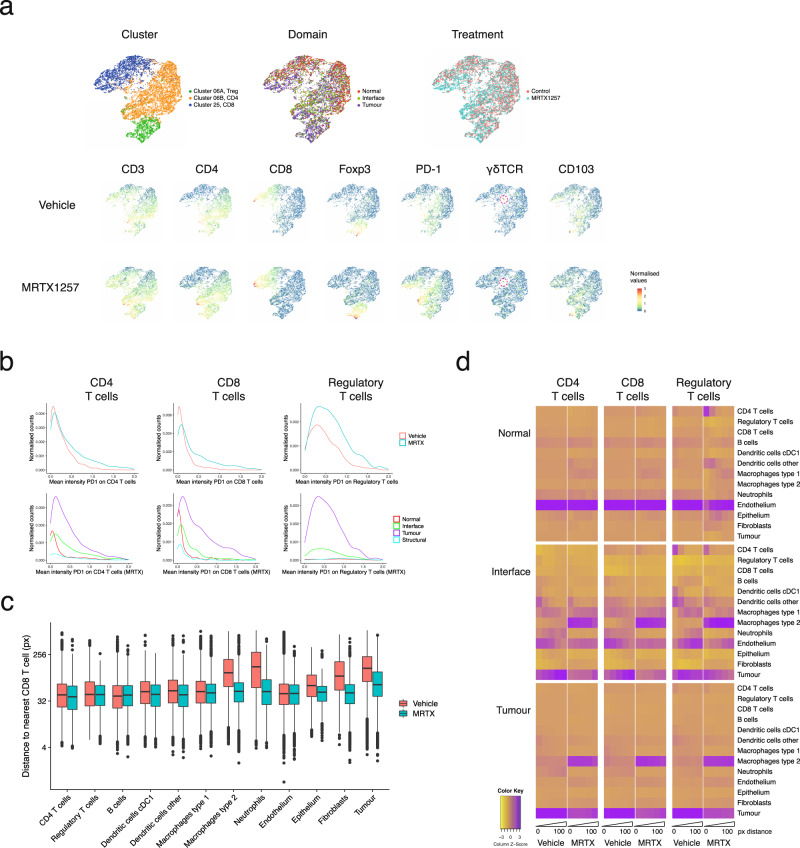
Fig. 5. Phenotypic and spatial characterisation of T cells in response to treatment.
a uMAP of T cell clusters (top left), coloured by tissue domain (top middle), treatment (top right) and the expression of individual markers that were selected for the generation of these uMAPs in the bottom two rows, data separated by treatment group. b T cells upregulate PD-1 upon MRTX1257 treatment, but only those within the tumour domain. Histograms plotting the normalised counts for the mean intensity of PD-1 per CD4+ CD8+ or regulatory T cell. Top: data separated by treatment, bottom: MRTX1257 treated samples only, separated by tissue domain. c Box-and-whiskers plot depicting the distance of cell types to the nearest CD8+ T cell. In vehicle-treated tumours, CD8+ T cells are on average found in the proximity of other lymphocytes, endothelium, DCs and Type 1 macrophages, but not close to tumour, fibroblasts or Type 2 macrophages. Upon MRTX1257 treatment, these distances generally become shorter, reflective of migration of CD8+ T cells into the tumour domain accompanied by an increased presence of Type 2 macrophages and fibroblasts within the tumour. Boxes minima and maxima represent 25th and 75th percentile, centre depicts the median, whiskers indicate 1.5× interquartile range, dots are individual outliers. Linear mixed-effects modelling confirmed that between treatments the cell types display a significantly different distribution of distances to a nearest CD8 T cell (P value = 0.0001 for treatment:cell type interaction, ANOVA tested). d Heatmaps for the different domains displaying cells in close proximity to the cell type of interest, separated by treatment and binned in distances from the centre of the cell (bins: 0–20px, 20–40px, 40–60px, 60–80px and 80–100px). Scaled on columns to show the relative contribution of cell types to the neighbourhood. MRTX MRTX1257, px pixels.

