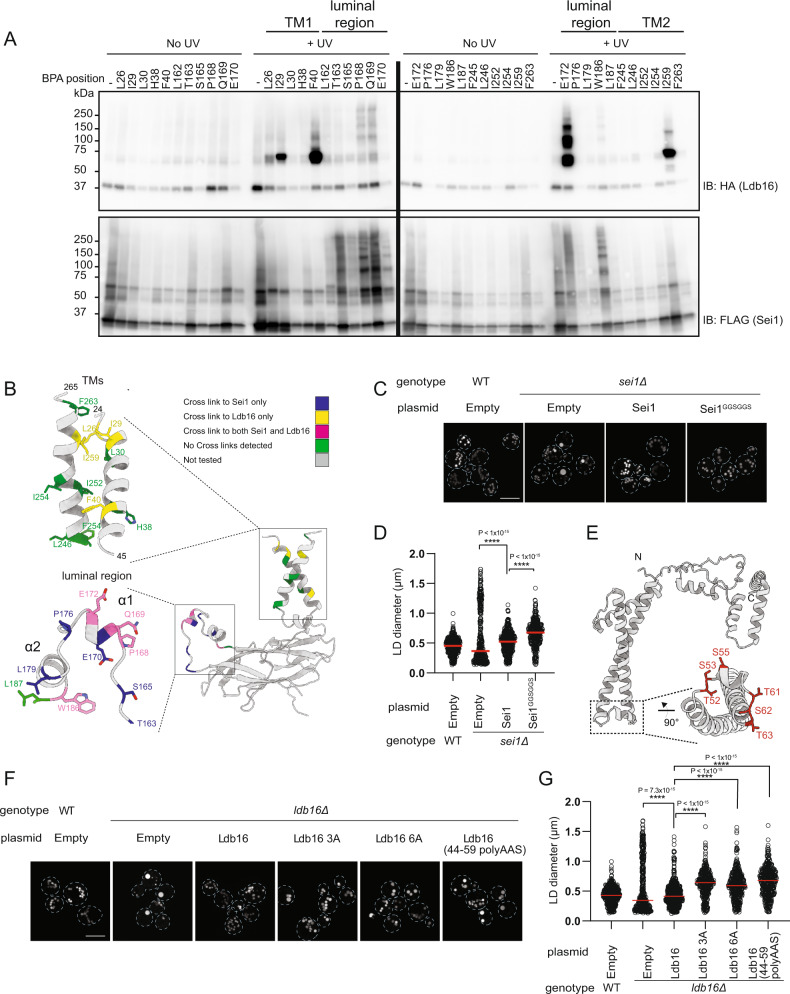
Fig. 3. Ldb16 complements Sei1 structure for LD formation.
A sei1∆ cells expressing endogenously HA-tagged Ldb16 and plasmid-borne SEI1-FLAG with a photoreactive Bpa at the indicated positions were subjected to UV irradiation. Non-irradiated cells were used as controls. Solubilized membranes were subjected to immunoprecipitation with anti-FLAG antibodies, and bound proteins were analyzed by immunoblotting with FLAG and HA antibodies. B Schematic representation of the Sei1-Sei1 and Sei1-Ldb16 site-specific photo-crosslinks obtained in (A). C Analysis of LDs in cells with the indicated genotype after staining with the neutral lipid dye BODIPY 493/503. Scale bar corresponds to 5 µm. D Quantification of LD diameter of cells shown in (C). At least 100 LDs were analysed for a minimum of 3 biological repeats. Red bars represent median diameter. n = 3. Difference in distribution of LD size was tested using a two sided Kolmogorov-Smirnov test (**** p < 0.0001, n.s. non-significant). E Cartoon of Ldb16 In silico structural prediction by trRosetta. Inset shows a short helical element rich in hydroxylated residues (in red). F Analysis of LDs in cells with the indicated genotype after staining with the neutral lipid dye BODIPY493/503. Scale bar corresponds to 5 µm. G Quantification of LD diameter of cells shown in (F). At least 100 LDs were analysed for a minimum of 3 biological repeats. Red bars represent median diameter. n = 3. Difference in distribution of LD size was tested using a two sided Kolmogorov-Smirnov test (**** p < 0.0001, n.s. non-significant).

