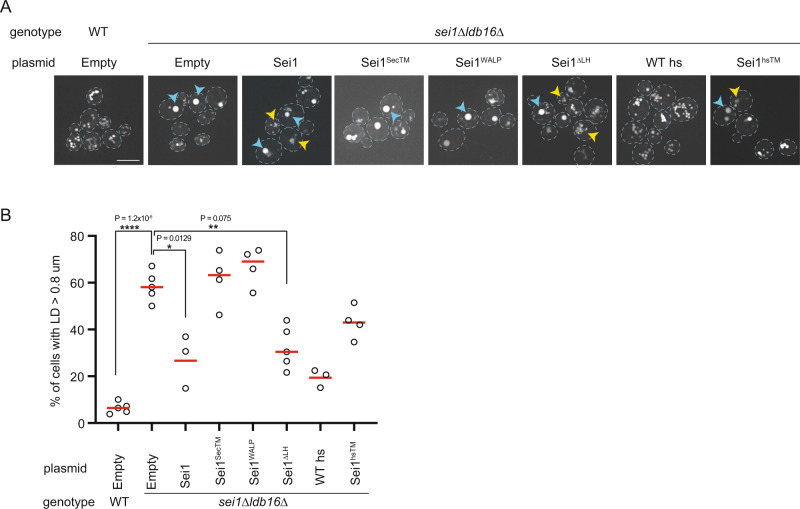
Fig. 5. Sei1 transmembrane segments contribute to LD formation.
A Analysis of LDs in cells with the indicated genotype after staining with the neutral lipid dye Bodipy493/503. Scale bar corresponds to 5 µm. Blue and yellow arrowheads indicate supersized LDs (ssLDs) and LD aggregates, respectively. B Quantification of ssLDs in cells with the indicated genotype. At least 50 cells were analysed per strain for a minimum of 3 biological replicates (WT empty vector, n = 5; sei1Δldb16Δ empty vector and Sei1ΔLH, n = 5; sei1Δldb16Δ Sei1SecTM Sei1WALP and Sei1hsTM, n = 4; sei1Δldb16Δ Sei1 and WThs, n = 3). Red bars represent median percentage. Difference in frequency of ssLDs was tested using a two sided paired t-test (*p < 0.05, **p < 0.01, ****p < 0.0001, n.s. non-significant).

