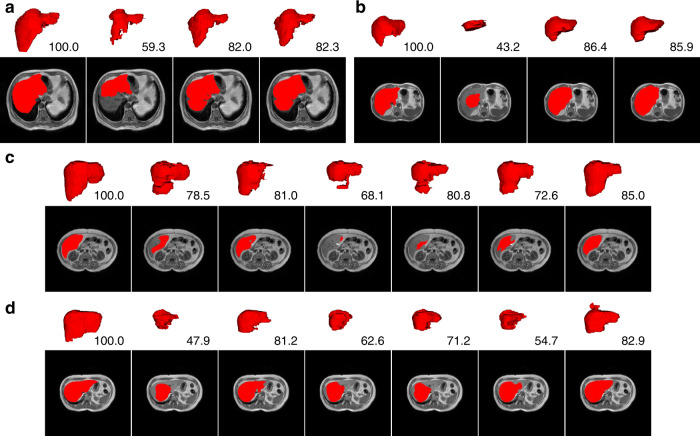
Fig. 2. Visualizations of label correction and segmentation results for SSL.
a, b Example results of training data label correction. The red regions in the four images from left to right correspond to the high-quality label, the low-quality label utilized to train the model, and the self-corrected labels of the two networks, respectively. c, d Example segmentation results. The first columns are the corresponding high-quality labels. The second to the last columns are the results achieved under settings S02, S04, S06, S08, S10, and S12 in Table 1. The numbers are the DSC values (%). In each subfigure, the first row (white background) shows the segmentation results in 3D rendering, and the second row (black background) gives the results of a single selected slice in 2D.

