Figure 2.
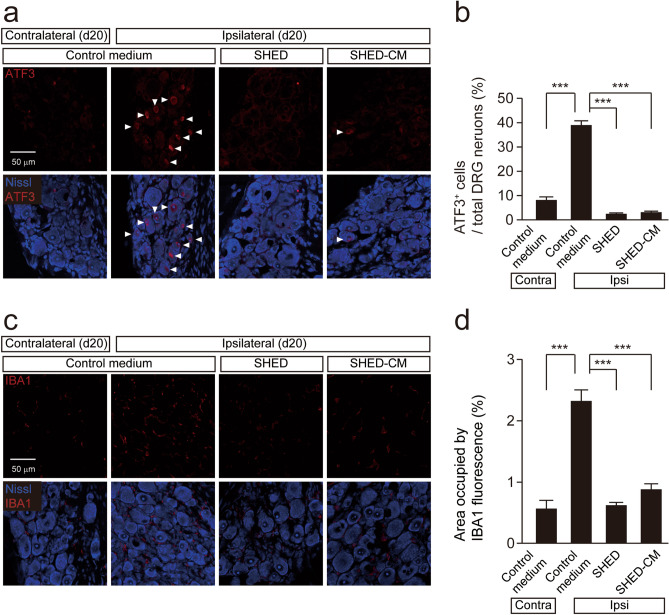
The inhibitory effect of SHED and SHED-CM on the AFT3 expression and macrophage accumulation in the ipsilateral side of DRG after nerve injury. (a) The image showing ATF3 (red) and Nissl (blue) immunofluorescence in the DRG 20 days after peripheral nerve injury (PNI). Arrowheads indicate ATF3 positive neurons. (b) The mean number of ATF3 positive neurons in the ipsilateral side of DRG following PNI. Data represent the mean ± SEM. n = 5 (control medium, contralateral: 222 ATF3 positive neurons/2820 Nissl positive neurons, ipsilateral: 546 ATF3 positive neurons/1386 Nissl positive neurons); n = 7 (SHED, 60 ATF3 positive neurons/2361 Nissl positive neurons); n = 5 (SHED-CM, 57 ATF3 positive neurons/1752 Nissl positive neurons), one-way ANOVA post hoc Tukey’s test. Asterisks indicate a statistically significant difference between the values (***p < 0.001). (c) The image showing IBA1 (red) and Nissl (blue) immunofluorescence in the DRG 20 days after PNI. (d) The mean area occupied by IBA1 fluorescence in the ipsilateral side of DRG following PNI. Data represent the mean ± SEM. n = 5 (control medium); n = 7 (SHED); n = 5 (SHED-CM,), one-way ANOVA post hoc Tukey’s test. Asterisks indicate a statistically significant difference between the values (*p < 0.05, **p < 0.01, ***p < 0.001).

