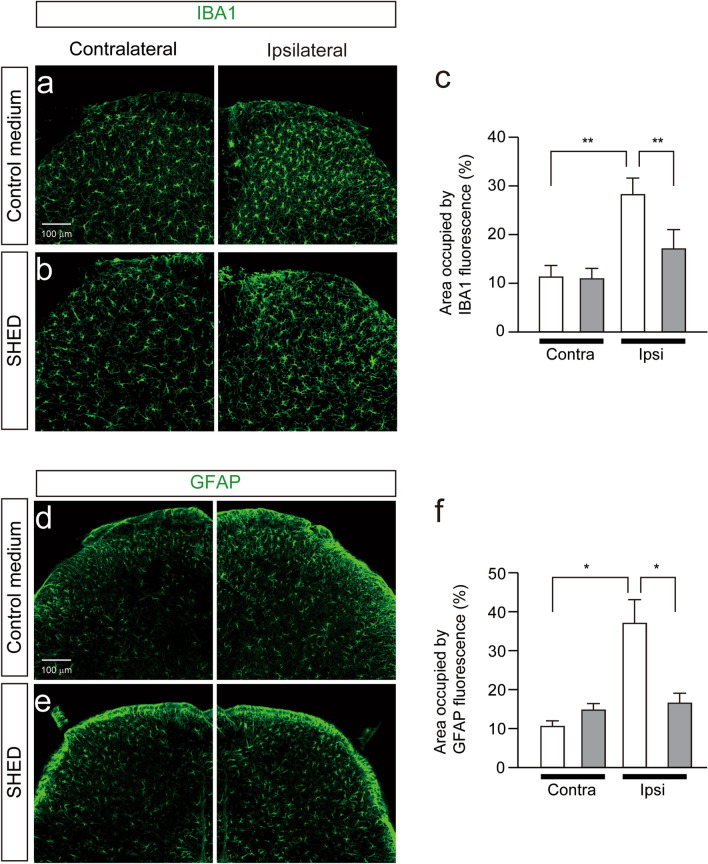
Figure 3.
Inhibitory effect of SHED administration on the accumulation of activated microglia and reactive astrocytes in the spinal dorsal horn. (a,b) The immunofluorescent CLSM images for IBA1 (a) and GFAP (b) in the spinal dorsal horn 15 days after control medium administration in nerve-injured mice. Scale bar = 100 μm. (c) The columns represent the mean area occupied by IBA1 fluorescence in the SDH. Data represent the mean ± SEM. n = 5. Two-way ANOVA Tukey’s test (**p < 0.01). (d,e) The immunofluorescent CLSM images for IBA1 (c) and GFAP (d) in the dorsal spinal cord 15 days after SHED administration in nerve-injured mice. Scale bar = 100 μm. (f) The columns represent the mean area occupied by IBA1 fluorescence in the SDH. Data represent the mean ± SEM. n = 5. Two-way ANOVA post hoc Tukey’s test (**p < 0.01).

