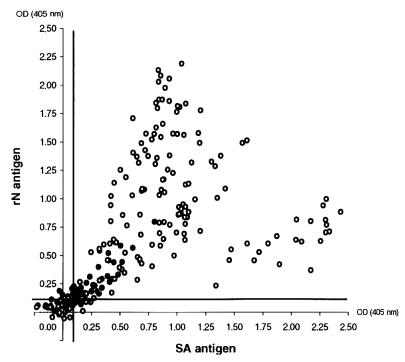
FIG. 2.
TOS virus-specific IgG detection in sera from a healthy population (black circles) and patients (open circles). The correlation between the OD values obtained by the SA- and rN-ELISAs, reported on the abscissa and the ordinate, respectively, is shown. The bold lines indicate the cutoff value for each assay.

