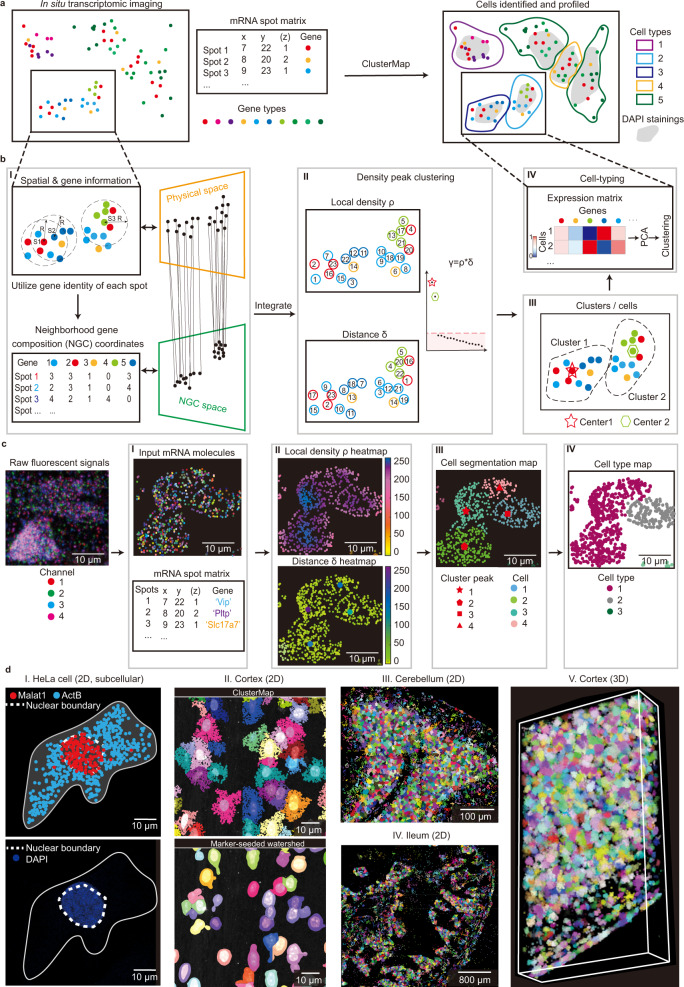
Fig. 1. ClusterMap: multi-scale spatial clustering analysis of in situ transcriptomic data from subcellular to tissue scales.
a Overview of ClusterMap method. The input is a matrix that contains both spatial and transcript information of mRNA molecules sequenced by in situ transcriptomic methods1–8. ClusterMap clusters mRNA spots, identifies cells, and profiles them into different cell types as output. b Workflow of ClusterMap method. I, The physical and neighborhood gene composition (NGC) coordinates of mRNA spots are extracted for each spot (e.g., S1, S2, and S3), and projected to physical and NGC spaces respectively, which are then computationally integrated. II, Density peak clustering (DPC) algorithm18 is used to cluster mRNA in the P-NGC space. III, Each spot is assigned to one cluster, representing one cell. IV, Cell types are identified by the gene expression profiles in each cell. c Representative ClusterMap analysis on STARmap mouse V1 1020-gene dataset6 corresponds to (I–IV) in b. d Representative ClusterMap cell segmentation analysis on different samples. I, HeLa cell in two-dimensional (2D) space. The white dashed lines highlight the nuclear boundary identified by the subcellular mRNA distribution from ClusterMap (upper) and DAPI staining (bottom) from the same cell. II. Comparison of ClusterMap (upper) and marker-seeded watershed (bottom) segmentation in mouse visual cortex cells. III, Mouse cerebellum in 2D, 4050 cells. IV, Mouse ileum in 2D, 5550 cells. V, Mouse visual cortex in 3D space, 2251 cells. Width: 309 µm, height: 582 µm, depth: 100 µm.

