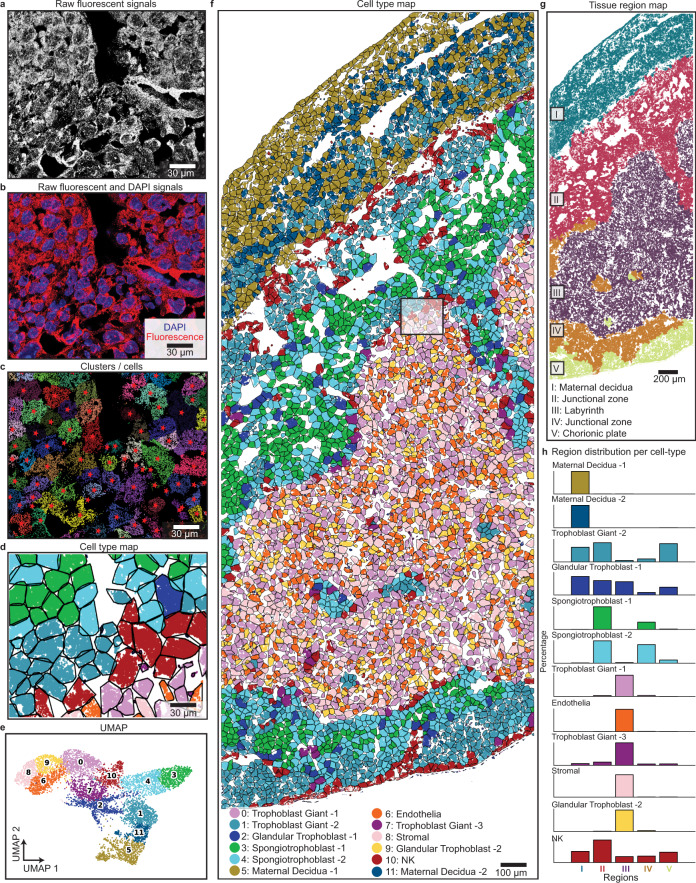
Fig. 3. ClusterMap generates cell-type and tissue-region maps in mouse placenta.
a Raw fluorescent signals for a part in the STARmap mouse placenta 903-gene dataset6. Four-channel images in the first sequencing round are overlapped in grayscale to show the mRNA distribution. b Composite image by overlapping (a) in red and DAPI signals in blue shows the distribution of mRNA relative to cell nuclei. A majority of mRNA molecules distributed outside the cell nucleus, resulting in holes in the cell center. c, d ClusterMap generates cell segmentation map (c) and cell-type map (d) of (a). Panels a–d show the zoomed-in view from the highlighted rectangle in f, the original dataset. e Uniform manifold approximation plot (UMAP) shows clustering of 11 groups across 7224 cells in the original placental dataset. f Spatial organization of the cell types in the placental tissue section. The number of cells in each type is as follows: Trophoblast Giant-1 (TG-1), 848; Endothelial (Endo), 578; Stromal (Stro), 418; Trophoblast Giant-2 (TG-2), 833; Maternal Decidua-1 (MD-1), 735; Glandular Trophoblast-1 (GT-1), 717; Spongiotrophoblast-1 (ST-1), 697; Spongiotrophoblast-2 (ST-2), 680; Trophoblast Giant-3 (TG-3), 544; Glandular Trophoblast-2 (GT-2), 410; NK, 404; Maternal Decidua-2 (MD-2), 360. g The spatial tissue region map of f. h Bar plots of composition of 12 cell types across 5 regions. Values are normalized in each row. Cell types in f, h are color-coded as in e.

