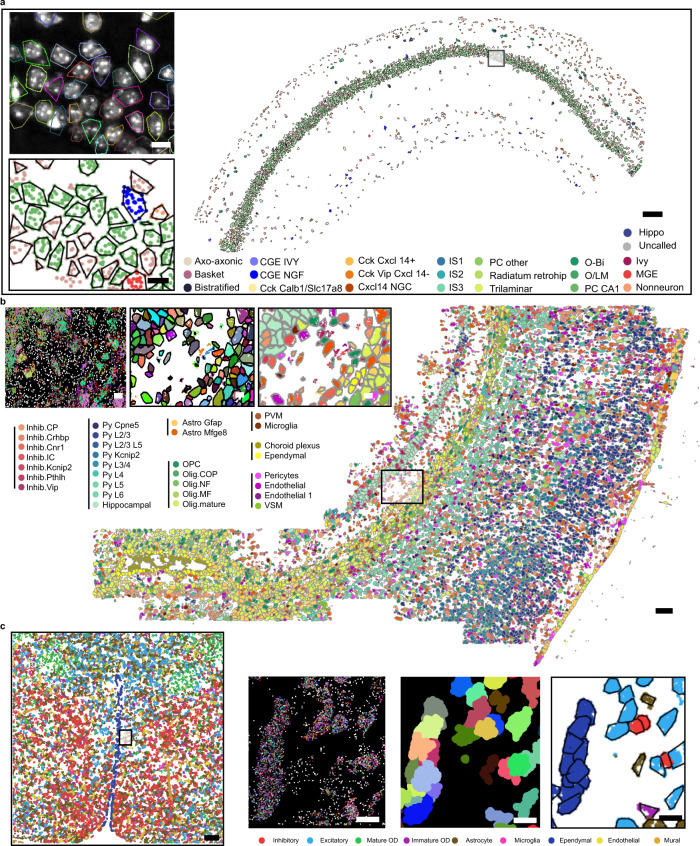
Fig. 5. ClusterMap across different spatial transcriptomics methods.
a Cell type map of the pciSeq (ISS data) section 4–3 left CA1 dataset4. Scale bar: 200 µm. Insets from top to bottom: convex hull of ClusterMap-identified cells overlapped with the DAPI image and zoom-in cell type map in the black box highlighted region. Scale bar: 10 µm. b Cell type map of whole osmFISH mouse SSp datasets5. Scale bar: 100 µm. Insets from left to right: raw spatial transcriptomics data, and corresponding cell segmentation map and cell type map of the black box highlighted region. Scale bar: 10 µm. c The 2D cell type map of whole MERFISH mouse POA datasets3. Scale bar: 200 µm. Insets from left to right insets: 2D raw spatial transcriptomics data, and corresponding cell segmentation map and cell type map of the highlighted region. Scale bar: 10 µm.

