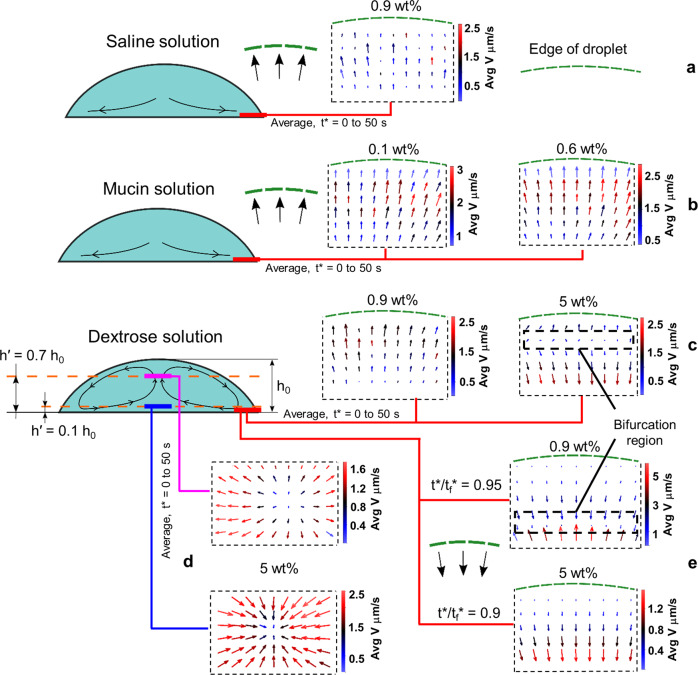
Fig. 4. Flow visualization for saline, mucin, and dextrose medium droplets.
a Vector plot (averaged over the first 50 s) depicting capillary flow at the edge for a droplet of saline solution. b Vector plot (averaged over the first 50 s) depicting capillary flow at the edge for droplets of mucin 0.6 wt% and 0.1 wt% solutions. c Vector plot (averaged over the first 50 s) depicting weak solutal marangoni for dextrose 0.9 wt% and strong solutal marangoni for dextrose 5 wt% at the edge. d Vector plots (averaged over the first 50 s) depicting marangoni flow for dextrose 5 wt% at two different heights ( = 0.1 and 0.7) in the center of the droplet. e Receding flow due to marangoni at the final stages of evaporation for dextrose 0.9 wt% and 5 wt%. t* is the elapsed time. tf is the final time of evaporation.

