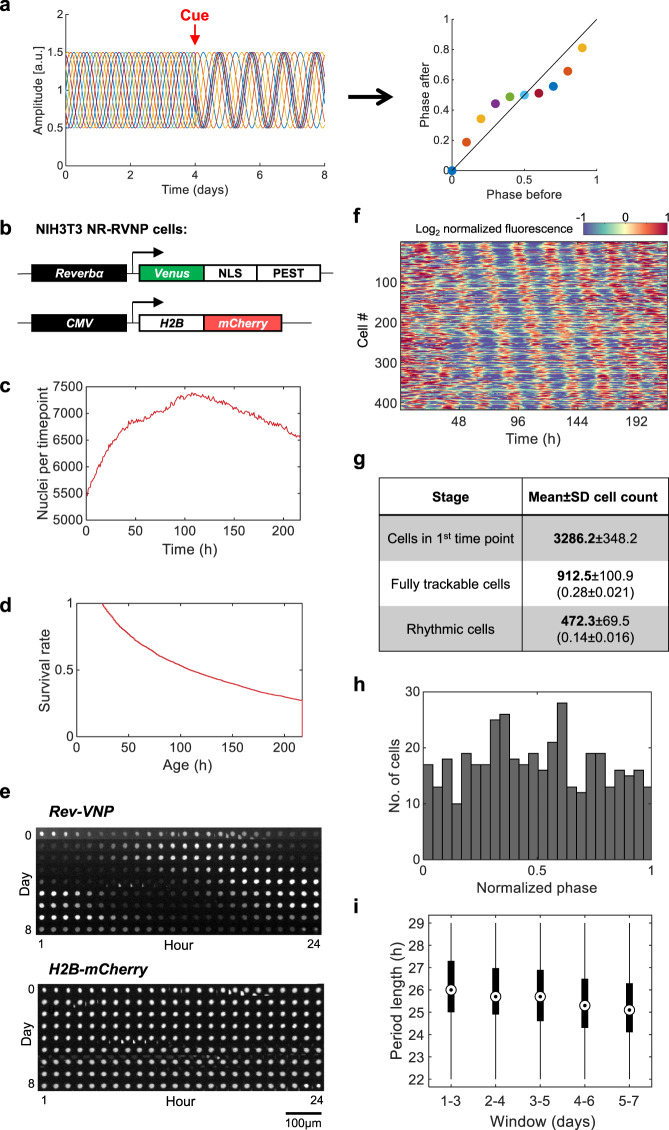
Fig. 1. Automated long-term single-cell tracking and rhythmicity analysis.
a Schematic depiction of the principle underlying Circa-SCOPE: a non-synchronized cell population is exposed to a single time intervention (“cue”). The clock in each cell is expected to respond according to its initial phase. By continuously monitoring single-cell rhythmicity, a full high-resolution PTC can be reconstructed based on data retrieved from a single population. b NIH-3T3 NR-RVNP cells (Nuclear Red, Rev-VNP) stably express the following constructs: a Reverbα-Venus-NLS-PEST (Rev-VNP) and CMV-H2B-mCherry. NLS: Nuclear Localization Signal; PEST: a proteolysis signal peptide from the mouse Odc1 gene; H2B: Histone 2B. c–i Recordings of NIH-3T3 NR-RVNP cells for nine consecutive days using the IncuCyte microscope. c The total number of nuclei detected per time point throughout the experiment in one representative well (the data in panels d–f and h–i are retrieved from the same population). d The survival rate throughout the experiment of the cells detected at the first time point. e Example of time-lapse images of a single nucleus (out of 417 rhythmic traces) as tracked throughout the entire experiment of Rev-VNP (green fluorescence) and H2B-mCherry (red fluorescence) reporters. f Heatmap representation of the log2 normalized fluorescence of Rev-VNP, in all fully trackable rhythmic cells. Each row corresponds to a single cell (n = 417 cells in total). g Summary table of the cell counts after each step of the analysis. (Mean ± SD from six different wells; In brackets: the fraction from cells in first-time point). h Phase distribution of the rhythmic cells, normalized to the period length of each cell (n = 417 cells in total). i Period length distribution of the rhythmic cells in 3-day windows across the experiment (n = 417 cells. Central circle: median; box: interquartile range (IQR); whiskers: extend to the maximal/minimal values within the range of ±1.5 IQR; circles: outliers). Source data are provided as a Source Data file.

