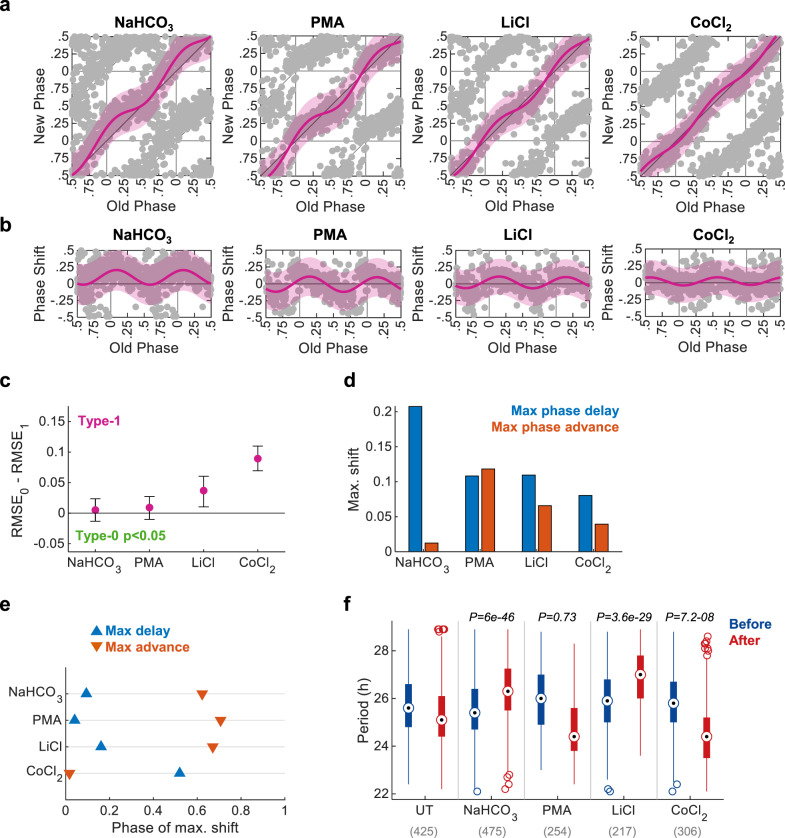
Fig. 3. Circa-SCOPE can identify diverse PTC topologies.
a PTC and b PRC representation of resetting experiments conducted with 100.25 mM of bicarbonate (initial concentration in the medium was 44 mM), 4 µM PMA, 25 mM LiCl, or 80 µM of CoCl2. Data are fitted with the type-1 model (pink) and presented ±95% confidence interval. All PTCs have significant response (p < 0.05 with bootstrapping test, n = 475, 254, 217, and 306 cells per condition respectively). c Model selection for each treatment. Dots represent the observed RMSE0–RMSE1, error bars represent the 95% confidence interval from bootstrapping test, and color indicates whether the test was significant for type-0 (one-sided). d Maximal phase shift for each treatment, based on the fitted type-1 model. e The phase in which the intervention elicited the maximal phase shift for each intervention. f Comparison of period length before and after each treatment (two-sample two-sided Student’s t test between the period-change (After–Before) of the UT control and the period-change in the treated group; n cells per condition indicated in brackets. Central circle: median; box: interquartile range (IQR); whiskers: extend to the maximal/minimal values within the range of ±1.5 IQR; circles: outliers). Source data are provided as a Source Data file and in Supplementary Dataset 2.

