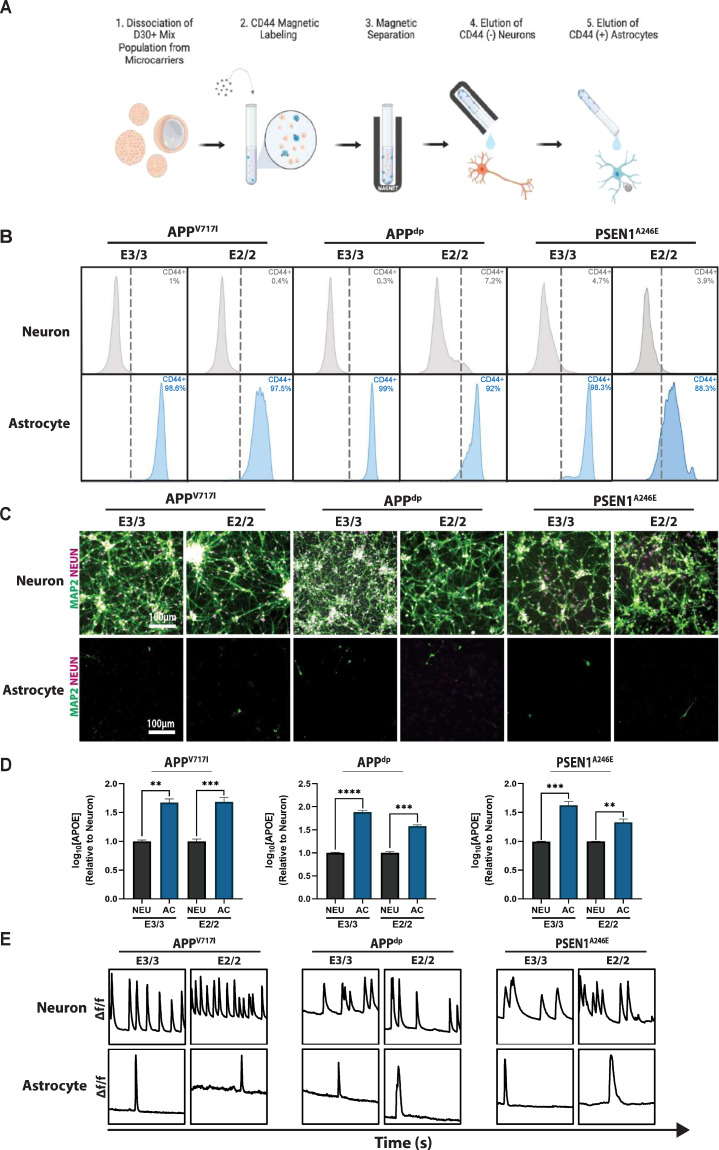
Fig. 3. Isolation of pure populations of neurons and astrocytes from mixed cultures.
A Schematic of magnetic-activated cell sorting (MACS) used to isolate pure neuronal and astrocytic cell populations. Schematic was generated using BioRender. B Representative flow cytometry analysis of CD44 expression in separated CD44− neurons and CD44 + astrocytes. C Immunofluorescence showing expression of mature neuron markers MAP2 and NEUN in neuron, but not astrocyte populations. D Quantification of APOE secretion by astrocyte and neuron populations. E Analysis of calcium transients shows slow calcium transients in the separated astrocytes compared to neuron populations. n = 3~5; *p < 0.05, **p < 0.01, ***p < 0.001, ****p < 0.0001.

