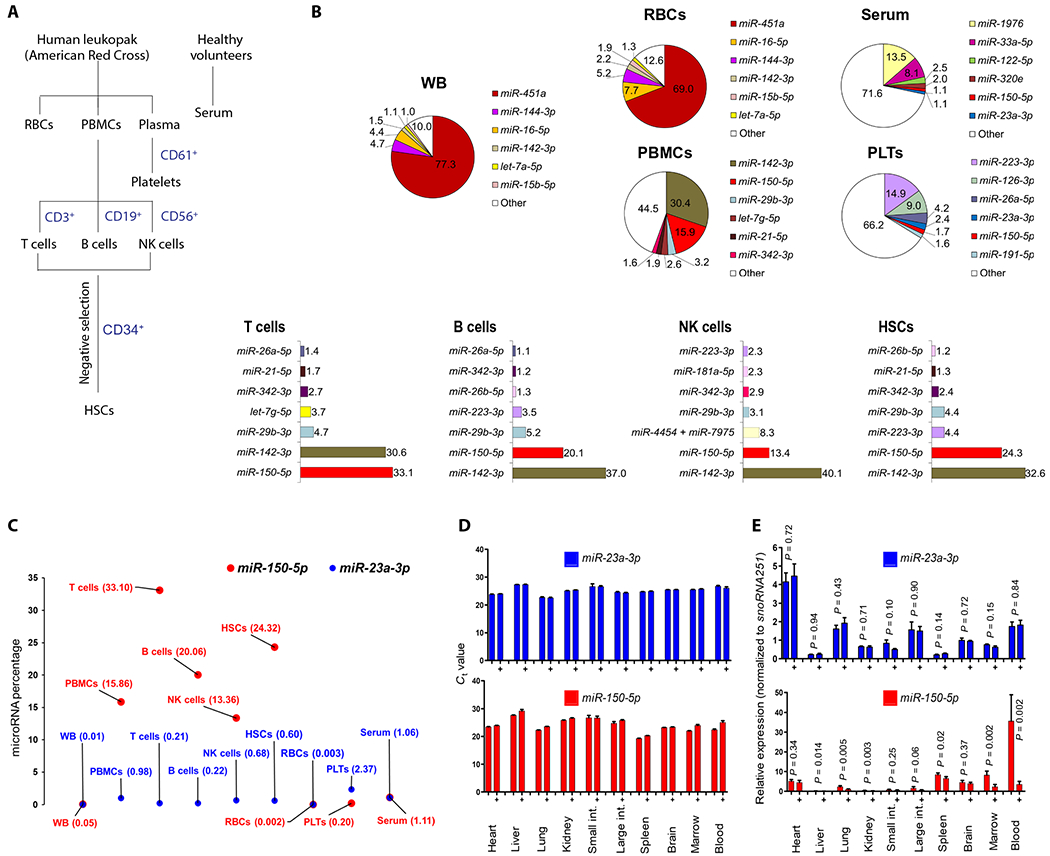
Fig. 1. PBMCs are the major source of radiation-sensitive miR-150-5p, and lungs are the major source of circulating radiation–nonresponsive miR-23a-3p.

(A) Schematic showing separation of human blood cell subsets for miRNA profiling. (B) Pie chart showing top six or seven miRNAs expressed in whole blood (WB), serum, red blood cells (RBCs), platelets (PLTs), and PBMCs, detected by the nanoString nCounter assay. PBMCs were further separated into T cells, B cells, NK cells, and HSCs. Percentage is calculated by normalized count of each miRNA divided by mean of total counts of all miRNAs in a sample. (C) Scatterplot comparing percentage of miR-150-5p and miR-23a-3p between WB, PBMCs, T cells, B cells, NK cells, HSCs, RBCs, platelets, and serum detected by nanoString profiling. (D) Ct values of qRT-PCR assay obtained for miR-150-5p and miR-23a-3p across the major organs in control and 2 Gy irradiated (+) mice 24 hours after TBI. (E) Relative expression of miR-150-5p and miR-23a-3p normalized to snoRNA251 in various tissues of control and 2 Gy irradiated (+) mice (24 hours). Data are mean ± SD of n = 4 to 5 mice per group, statistical significance by unpaired t test.
