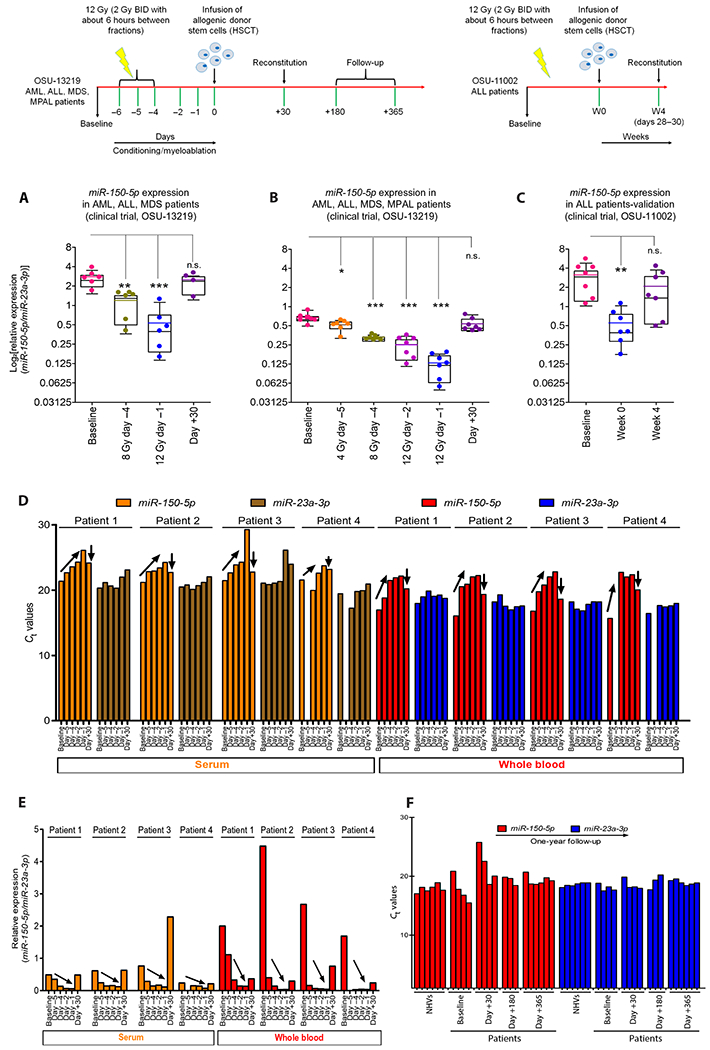
Fig. 2. Radiation dose response and kinetics of circulating miR-150-5p in bone marrow transplant (BMT) patients.

Top: Schematic of clinical trials OSU-13219 and OSU-11002 using radiation as a myeloablative conditioning regimen before allogeneic stem cell transplantation (HSCT), with sampling time points for miRNA analyses: OSU-13219 [baseline: day −5, 4 Gy (2 + 2 Gy); day −4, 8 Gy (2 + 2 + 2 + 2 Gy); day −2, 12 Gy (2 + 2 + 2 + 2 + 2 + 2 Gy); day −1 (before HSCT); and day +30] and OSU-11002 [baseline, week 0, and week 4 (days +28 to 30)]. (A) Dot-whisker plot shows depletion of miR-150-5p until day −1 and reconstitution at day +30 (n = 6 per time point except for day +30 with n = 4) in serum samples from OSU-13219 trial, and each dot represents patient sample. (B) For validation, more time points were added from newly enrolled patients (n = 7). (C) Dot-whisker plot depicts kinetics of miR-150-5p normalized to miR-23a-3p in cohort of patients from a different clinical trial, OSU-11002 (n = 7). For (A) to (C), the y axis represents miR-150-5p normalized to miR-23a-3p on a log2 scale. (D) Ct values of serum (orange and brown) and whole blood (red and blue) miR-150-5p and miR-23a-3p in four patients from OSU-13219 collected at baseline and at days−5, −4, −2, −1, and +30. Dose- and time-dependent depletion of miR-150-5p shown as an increase in Ct values until day −1 (upward-diagonal arrow) and reconstitution by day +30 (after HSCT) as a drop in Ct values. (E) Changes in normalized miR-150-5p in whole blood (red) and in serum (orange) in four patients as shown as ΔΔCt. (F) Ct values of miR-23a-3p (blue) and miR-150-5p (red) from qRT-PCR using RNA isolated from similar volumes of whole blood collected from normal healthy volunteers (NHVs) and patients (OSU-13219) at baseline and at days 30, 180, and 365 after HSCT; n = 6 for NHVs, n = 4 patients at baseline, n = 4 for day +30, n = 3 for day +180, and n = 6 for day +365. (A) to (D) were analyzed by a mixed-effect model with Bonferroni or Dunnett’s adjustment; *P < 0.05, **P < 0.01, and ***P < 0.001.
