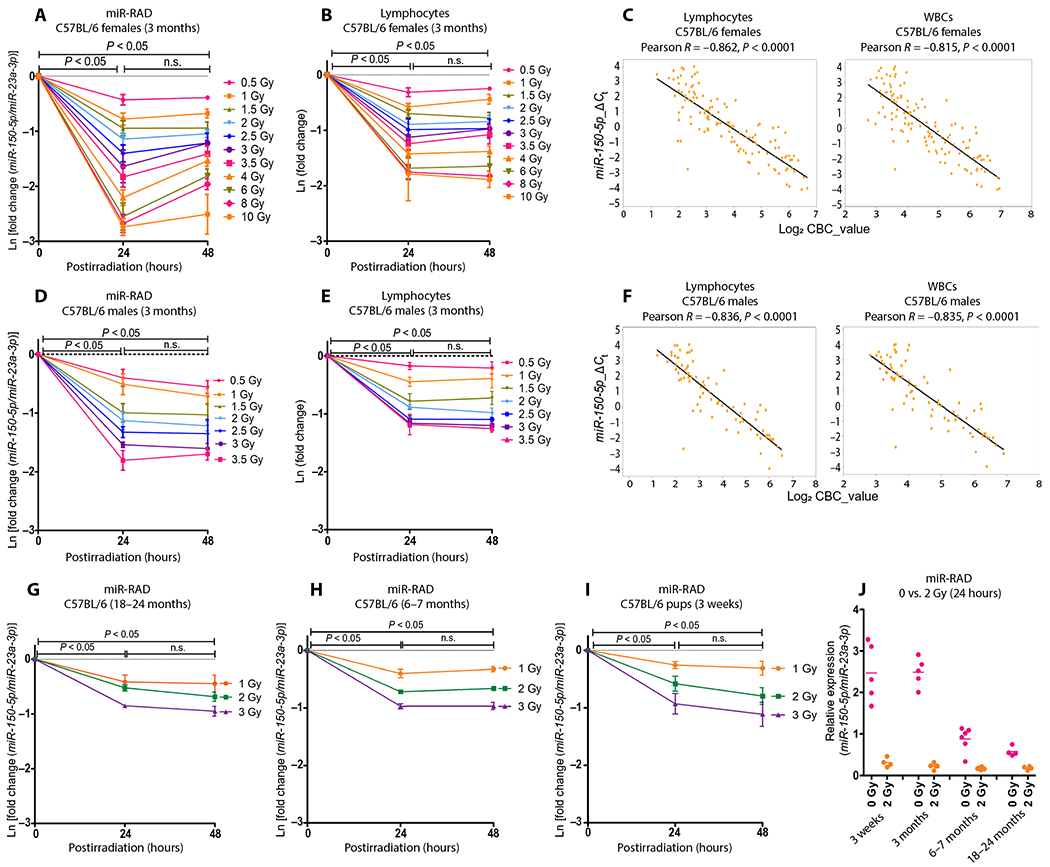
Fig. 3. miR-RAD (miR-150-5p/miR-23a-3p assay) as a sensitive and robust radiation biodosimeter in mice in a dose range relevant for triage after radiological events.

(A) Dose-time response in 3-month-old C57BL/6 female mice after total body exposure to 137Cs gamma rays (0.94 Gy/min) at a broad dose range (0.5 to 10 Gy) at 24 and 48 hours after TBI. miR-150-5p expression normalized to endogenous miR-23a-3p is plotted as fold expression on a natural logarithmic scale Ln[fold change (miR-150-5p/miR-23a-3p)] and (B) corresponding lymphocyte depletion kinetics, where the y axis is represented as natural logarithmic scale Ln(fold change). (C) Pearson correlation between miR-RAD and lymphocytes or white blood cells (WBCs), where the y axis represents ΔCt (miR-150-5p/miR-23a-3p) and the x axis represents the log2 of lymphocytes or WBC counts. (D) miR-RAD response in 3-month-old C57BL/6 male mice in the dose range 0.5 to 3.5 Gy at 24 and 48 hours after TBI, (E) corresponding lymphocyte depletion kinetics, and (F) Pearson correlation graphs between miR-RAD and lymphocytes or WBCs. (G) miR-RAD response of miR-150-5p normalized to miR-23a-3p at 1, 2, and 3 Gy doses in 18-to 24-month-old C57BL/6 (n = 4), (H) 6- to 7-month-old male and female C57BL/6 mice (n = 6), and (I) 3-week-old C57BL/6 mice (n = 4). (J) Dot plot shows the expression of miR-150-5p normalized with miR-23a-3p in mice with varying ages at baseline and 24 hours after 2 Gy TBI (n = 4 to 5). (A) and (B), (D) and (E), and (G) to (I) are mean ± SD and analyzed by two-way ANOVA with Bonferroni adjustment.
