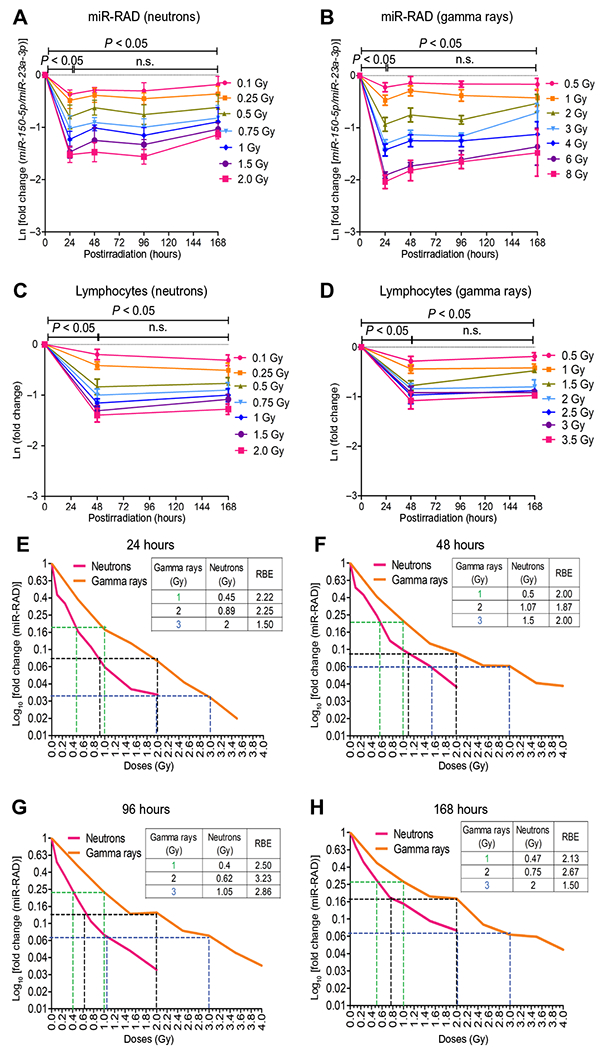
Fig. 4. Comparison of miR-RAD and CBC in mice exposed to IND-spectrum neutrons and gamma rays.

(A and B) Longitudinal evaluation of miR-150-5p normalized to miR-23a-3p at days 1 to 7 in 3-month-old C57BL/6 female mice after total body exposure to neutron (sham, 0.1, 0.25, 0.5, 0.75, 1.0, 1.5, or 2.0 Gy) or gamma rays (sham, 0.5, 1, 2, 3, 4, 6, or 8 Gy). miR-RAD response is plotted as natural logarithmic scale Ln[fold change (miR-150-5p/miR-23a-3p)]; n = 6 for neutrons or n = 5 for gamma rays. Corresponding lymphocyte depletion kinetics are shown in (C) and (D). (E to H) Relative biological effectiveness (RBE) of neutron to 1, 2, and 3 Gy gamma dose calculated at 24, 48, 96, and 168 hours plotted as log10[fold change (miR-RAD)]. (A) to (D) are mean ± SD and analyzed by two-way ANOVA with Bonferroni adjustment.
