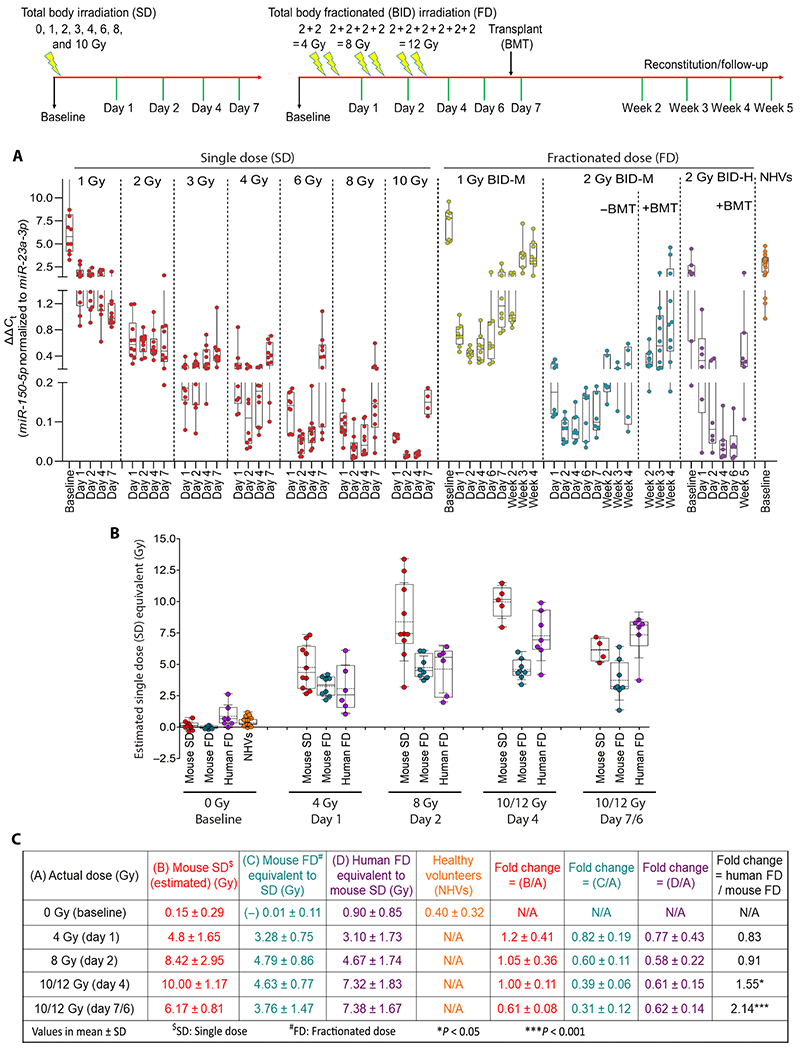
Fig. 6. Comparison of dose response after acute single versus fractionated irradiation in mice and humans.

Top: Schema represents single dose (SD) and fractionated irradiation (FD) and sampling time points. (A) Dot-whisker plot represents ΔΔCt values (miR-150-5p normalized to miR-23a-3p) comparing baseline, dose, and time-dependent changes after single dose (n = 5 to 10) and fractionated irradiation 1 Gy BID (n = 8); 2 Gy BID (n = 3 to 8); 2 Gy BID + BMT (Transplant) (n = 8 to 10) in mice; and 2 Gy BID + BMT in patients with leukemia (n = 6 to 7) and NHVs (n = 21). (B) Dot-whisker plot represents the estimated mouse single-dose equivalent dose for various groups using 48-hour dose reconstruction algorithm developed. (C) Summary of estimated single-dose equivalents of fractionated irradiation in various groups with fold changes and kinetics.
