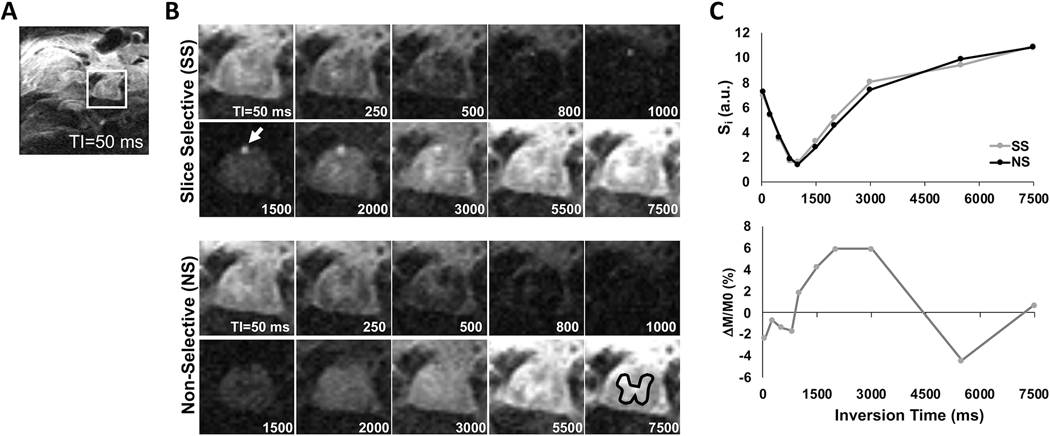
Figure 2.
Representative single-slice inversion recovery images of a sham animal. (A) Inversion recovery image (TI=50 ms) showing the full FOV in the thoracic cord. (B) Inversion recovery images across varying TI showing the change in contrast, highlighting the posterior spinal artery (arrow) and a gray matter ROI (black). (C) Signal intensity (Si; top) and perfusion weighted signal (ΔM/M0; bottom) from the gray matter ROI reveal the change in perfusion contrast across different inversion times (TI).

