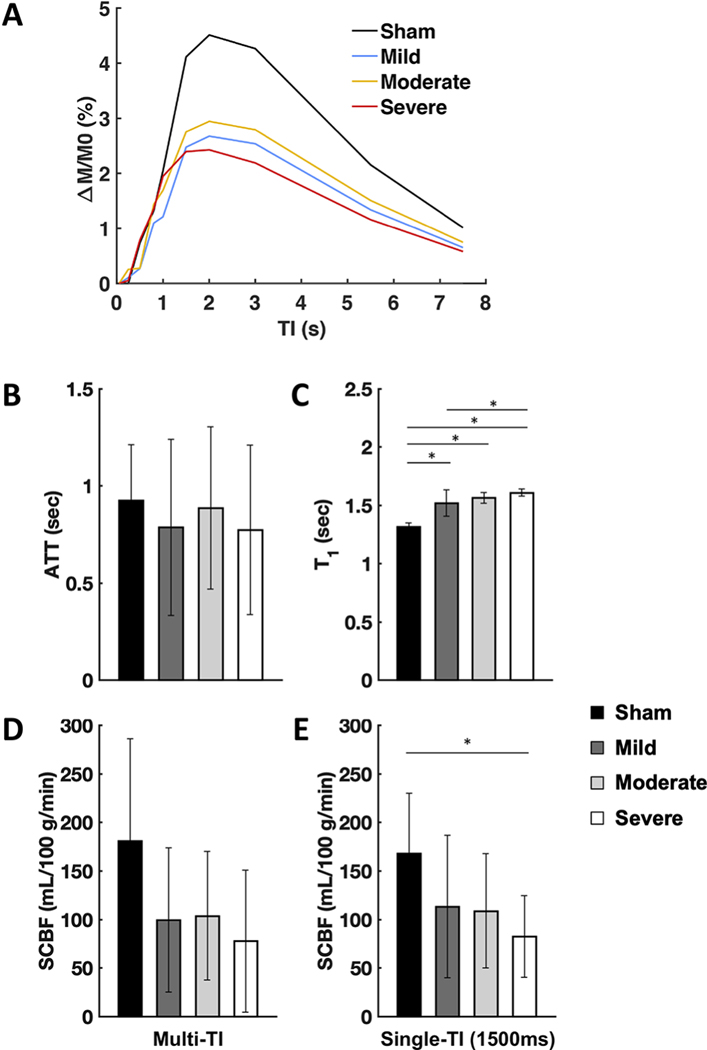
Figure 5.
Summary of metrics derived by FAIR. (A) Mean perfusion weighted contrast (DM/M0) as a function of inversion time for the whole-cord ROIs at the injury epicenter grouped by injury severity. For better visualization, estimates of group variability are not shown. (B) Arterial transit time (ATT) did not differ by severity. (C) T1 relaxation time constant increased as severity increased. (D) Multi-TI SCBF estimates were decreased after injury, but no consistent relationship of severity was evident.(E) Single-TI estimates of SCBF (TI=1500 ms) exhibited a similar trend but with severe injury having a significant decrease compared to sham animals. Error bars indicate standard deviation. *-significant difference at p< 0.05 (2-tailed).

