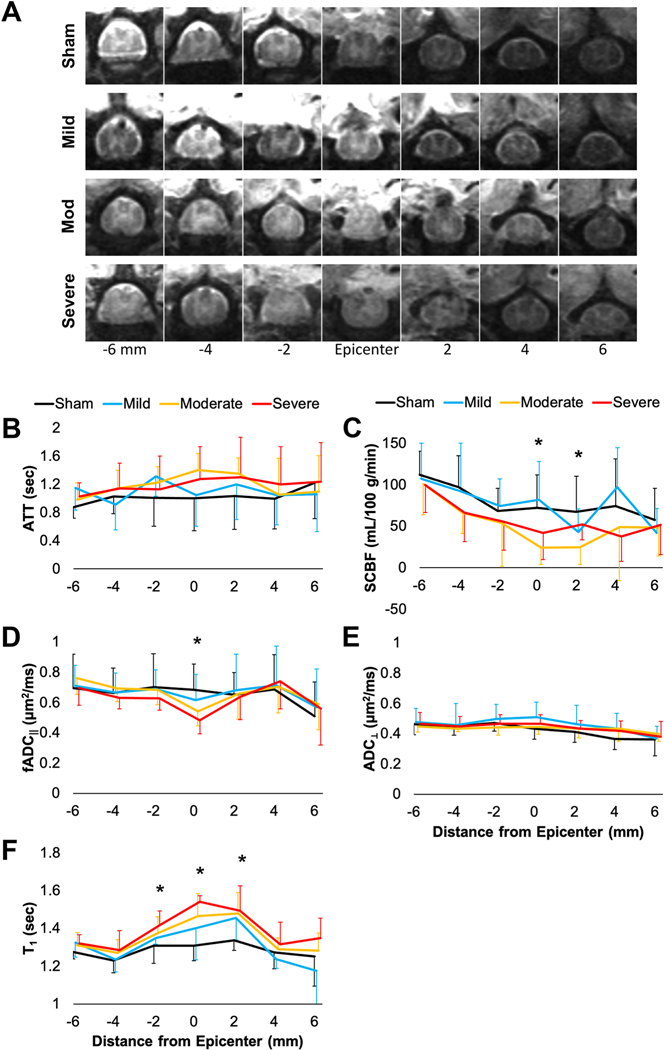
Figure 7.
Summary of whole-cord ROI mean values across the lesion site. Representative images (TI=7500 ms) from each injury severity (A). ATT (B) from multi-TI analysis did not appreciably differ across the cord or between different severities. SCBF (C) from single-TI (1500 ms) was significantly related to severity at the site of injury and one slice above the lesion. fADC‖ (D) was significantly related to severity at the lesion site but did not differ above or below the lesion. ADC⊥ (E) was not changed with injury. T1 (F) was significantly related to severity at the lesion site and one slice above and below. For better visualization, only positive or negative error bars are shown and indicate standard deviation. *-Main effect of injury severity, p<0.05.

