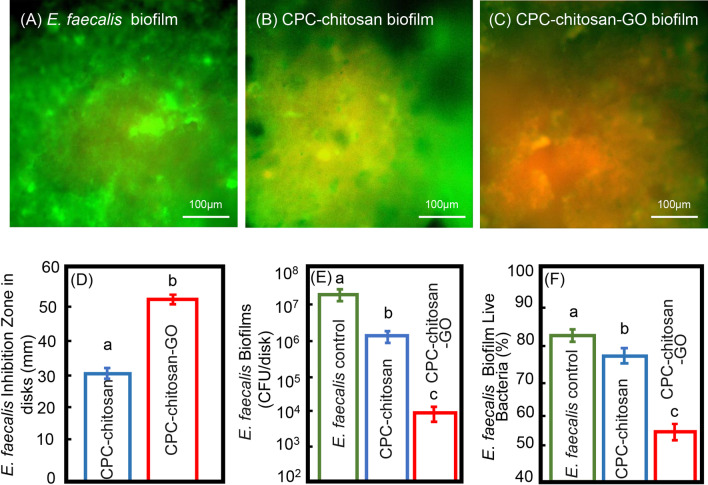
Fig. 3.
The antibacterial effects of CPC-chitosan scaffold and CPC-chitosan-GO disks were measured. Live and dead assay of bacterial biofilms on CPC-chitosan scaffold and CPC-chitosan-GO disks at 24 h. E. faecalis biofilms were served as control: The control group (A) and CPC-chitosan group (B) were covered by live bacteria. The CPC-chitosan-GO group (C) had more dead bacteria with red staining. Scale bar = 100 μm. D The inhibition zone size of CPC-chitosan decreased as compared with CPC-chitosan-GO (mean ± sd; n = 10). E CPC-chitosan-GO group demonstrated much lower biofilm CFU, compared to CPC-chitosan group (p < 0.05). F The percentage of live E. faecalis on CPC-chitosan scaffold and CPC-chitosan-GO disks. Dissimilar letters indicate significantly different values (p < 0.05)

