Fig. 3.
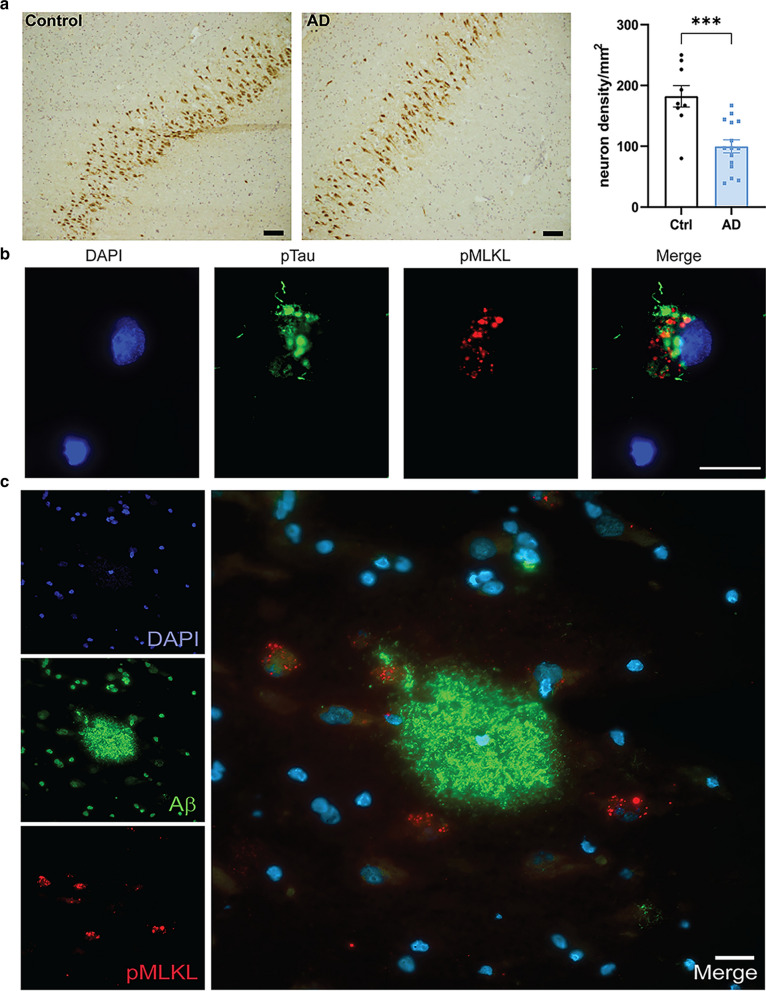
Association of pMLKL with AD pathology. a Representative images of CA1 pyramidal neurons stained with HuC/HuD antibody in the control and AD brain sections (scale bar = 100 µm); Quantification of the neuron density per mm2 in the control (n = 9) and AD (n = 15) hippocampal CA1 region. Data are represented as mean ± SEM, ***p < 0.001. b Representative immunofluorescence image of pTau (green) and pMLKL (red) with DAPI + cell nuclei in CA1 region of AD hippocampus. c Representative immunofluorescence image of Aβ (green) and pMLKL (red) with DAPI + cell nuclei in CA1 region of AD hippocampus. Scale bar = 20 µm

