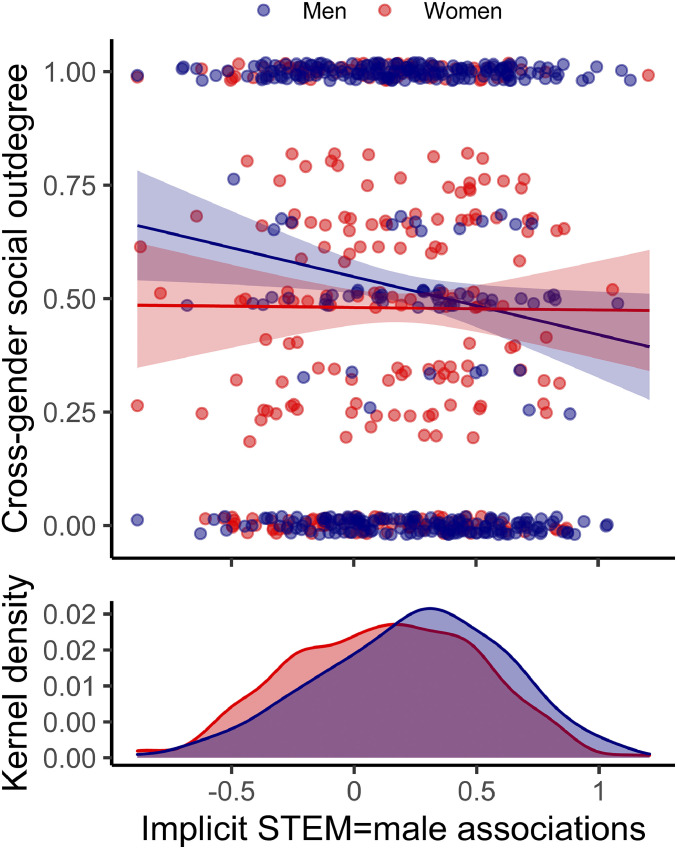
Fig. 1.
Linkage between implicit gender stereotypes and outgoing cross-gender social ties (outdegree; Top). Bright red denotes participants who are women, and dark blue denotes participants who are men. Scatter points represent raw data, jittered to avoid overplotting, with lines of best fit generated using the corresponding respect-based covariate from the full model. A kernel density plot displays the distribution of implicit STEM = male associations by participant gender (Bottom). Implicit associations have been winsorized to ±3 SDs from the mean.

