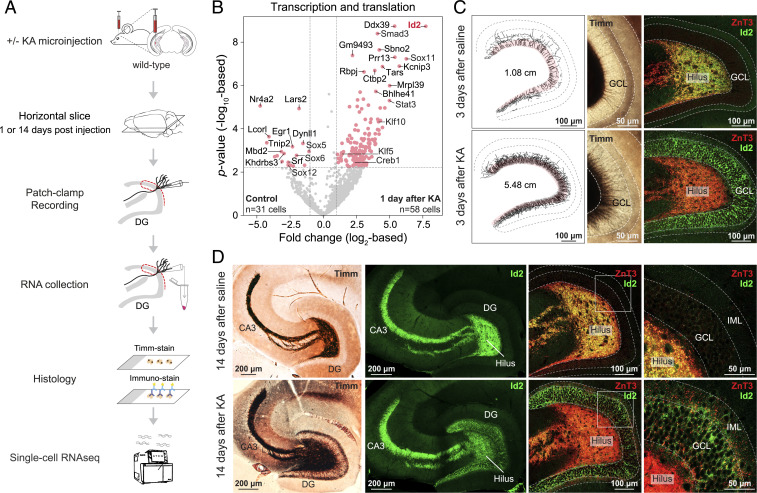
Fig. 1.
Transcriptomic analysis of chemically induced MF sprouting. (A) Experimental design. (B) Volcano plot shows acute transcriptomic changes of transcription and translation-related molecules in single GCs 1 d after KA induction of MF sprouting. Red points denote differentially expressed genes (FDR < 0.05 and >2-fold change, or |log2FC| > 1 as in plot). (C) MF sprouting is already ongoing and Id2 is up-regulated in GCL 3 d after KA induction. Upper panels show saline-injected controls; lower panels show KA. From left to right: Timm’s staining–based MF axon tracings reconstructed from 80-µm-thick sections; Timm’s-stained brain slices at higher magnification; immunohistochemical staining of ZnT3 and Id2. (D) MF sprouting develops and Id2 remains up-regulated in GCL 14 d after KA. Upper panels show saline-injected controls; lower panels show KA. From left to right: Timm’s-stained hippocampal slices displaying the whole MF system; immunostaining of Id2 in the MF system (note the presence of Id2 in naive fibers in hilus and CA3); immunostaining of ZnT3 and Id2 in dentate gyrus shown at higher magnifications.

