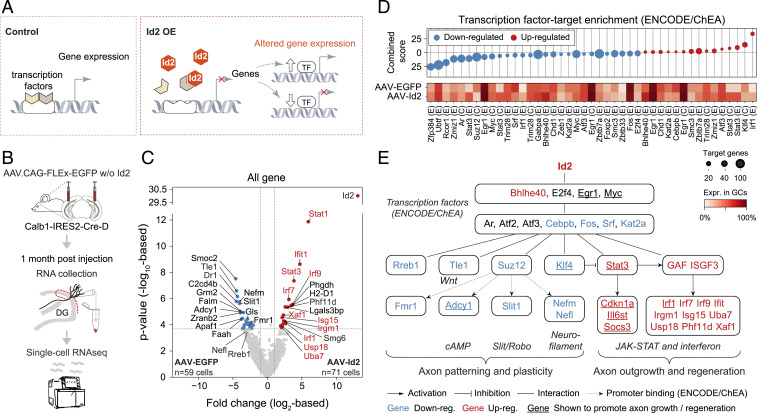
Fig. 5.
Single-cell transcriptomics reveal a comprehensive rewiring program induced by AAV-delivered Id2. (A) Drawing depicts transcriptional function of Id2. (B) Experimental strategy. (C) Volcano plot shows gene expression differences between AAV-EGFP (n = 59 cells) and AAV-Id2 (n = 71 cells)–delivered single GCs. Horizontal and vertical dashed lines show FDR = 0.05 and 2-fold change (|log2FC|>1), respectively. Gene names highlighted in red belong to the JAK-STAT and interferon pathways. (D) Enrichr transcription factor-target enrichment analysis based on 285 up-regulated (red) and 848 down-regulated genes (blue) that were differentially expressed (P < 0.05) between the AAV-EGFP or AAV-Id2 data sets. Identified transcription factors (E: Encode, C: ChEA) and their expression rate in GCs are shown in the bottom. Circle size represents the number of target genes present in the inputted data. (E) The gene regulatory network activated by AAV-Id2. Nodes represent molecules from C and D; edges represent interactions. GAF and ISGF3 refer to proteomic assembly of Stat1 homodimers and Stat1, Stat2, and Irf9, respectively (45).

