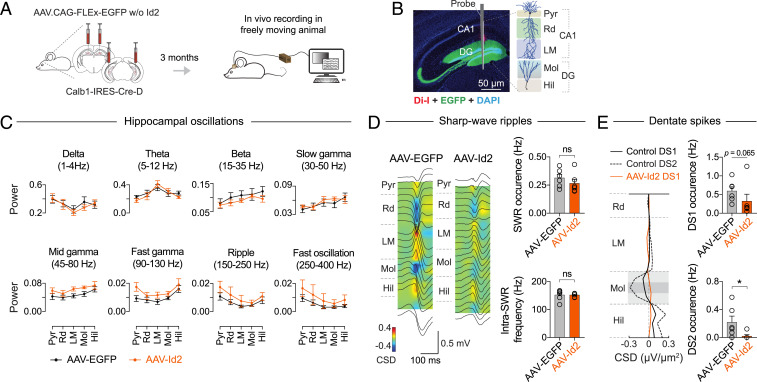
Fig. 6.
Hippocampal dynamics after AAV-Id2–induced MF rewiring. (A) Experimental design. After AAV-EGFP and AAV-Id2 injections, each mouse was implanted with a linear silicon probe in dorsal hippocampus. Three months after AAV delivery, recordings were made from freely moving mice. (B) Histological image of a silicon probe track through the hippocampus (Pyr: pyramidal layer, Rd: radiatum, LM: lacunosum-moleculare, Mol: molecular layer, Hil: hilus). (C) Local field potential (LFP) power of delta, theta, beta, slow gamma, midgamma, fast gamma (all during locomotion), and ripple and fast ripple (during resting) range frequencies (AAV-EGFP, n = 7 mice; AAV-Id2, n = 6 mice). Neither pair-wise comparisons between the AAV-EGFP and AAV-Id2 groups revealed statistically significant (P < 0.05) differences using two-way ANOVA test. (D) Left: Regional distribution of currents associated with SWRs in ripple peak-triggered CSD maps; average LFP waveforms (black traces) are shown superimposed. Right: Quantification of ripple occurrence (Mann–Whitney U test, P = 0.31) and intraripple frequency in CA1 Pyr and Rd (Mann–Whitney U test, P = 0.45; AAV-EGFP, n = 6 mice; AAV-Id2, n = 6 mice). (E) Left: CSD profiles of DS1 and DS2. Right: Quantification of DS1 (Mann–Whitney U test, P = 0.065) and DS2 (Mann–Whitney U test, P = 0.015; AAV-EGFP, n = 6 mice; AAV-Id2, n = 6) occurrence.

