Fig. 4.
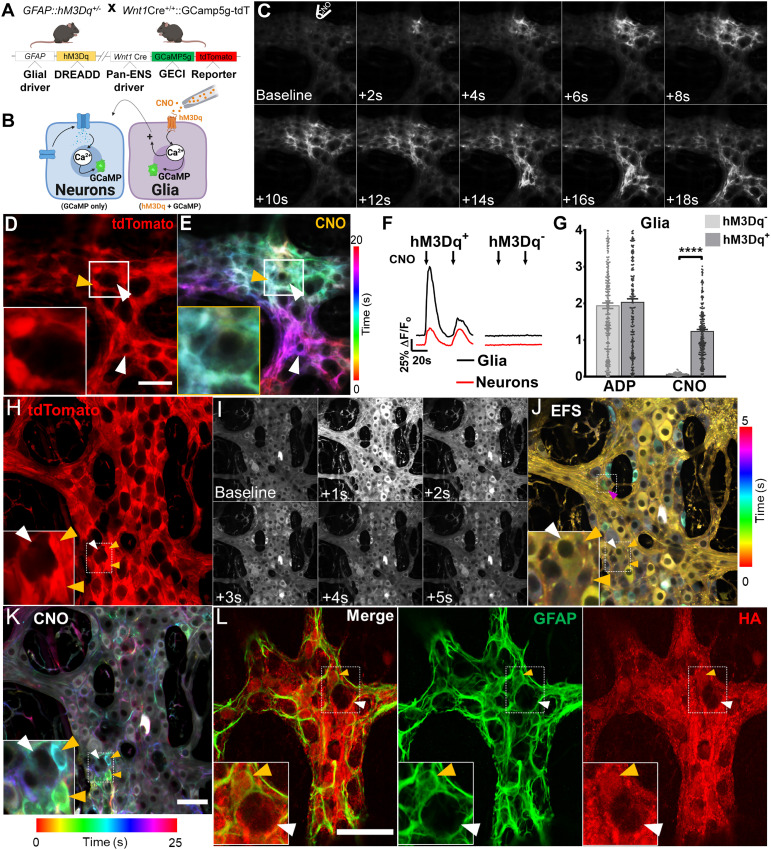
Effects of glial chemogenetic activation on myenteric networks. (A) Schematic diagram demonstrating mouse genotype. (B) Enteric glia are directly activated by direct application of CNO to the ganglion. (C) Still-frame montage depicting propagation of the CNO-induced Ca2+ response throughout the glial cell network, which is accompanied by eventual recruitment of enteric neurons within the vicinity. (D) tdTomato expression is highest in glia (SI Appendix, Fig. S1). (E) Color-coded temporal responses evoked by focal application of CNO overlap with glial tdTomato signals, confirming functional expression of the DREADD receptor in enteric glial cells (yellow arrowhead) but not enteric neurons (white arrowhead). Glial activation by CNO can nevertheless recruit neurons (lower white arrowhead), demonstrating intact glia-to-neuron recruitment pathways. (F) Representative tracings depict average Ca2+ response evoked by CNO in enteric glia (black tracings) and neurons (red tracings) in DREADD mice (Left) compared with DREADD-null littermates (Right). Time courses shown are typical of the response evoked by CNO in enteric glia. (G) Peak Ca2+ response evoked by glial agonists in DREADD-positive (hM3Dq+) mice and DREADD-null littermates (hM3Dq−). (H) In situ expression of native tdTomato signals within the myenteric plexus of DREADD mice, imaged by confocal fluorescence microscopy. (I) Time-lapse montage of EFS-induced Ca2+ responses. (J) Color-coded temporal projection of responses in I, with the topmost box depicting glial recruitment by neurons (magenta arrowhead) and preservation of neuro–glial communication pathways in this model. (Inset) Neuronal response to EFS (white arrowhead) and the absence of a response in glia (orange arrowheads). (K) Color-coded temporal responses to bath-applied CNO in enteric glia. CNO responses overlap with tdTomato signals and are absent in adjacent neurons located nearby. (L) Immunohistochemical staining of a fixed myenteric plexus from a DREADD mouse. The plexus was probed for GFAP expression and hemagglutinin (HA; red channel), which is primarily expressed in GFAP+ enteric glia (orange arrowheads; green channel). By comparison, enteric neurons (white arrowheads) express substantially lower levels of HA. ****P < 0.0001.

