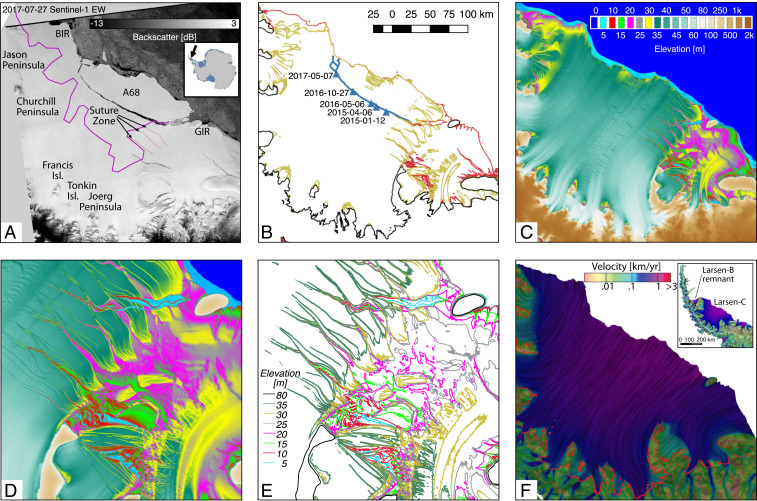
Fig. 1.
(A–F) Larsen Ice Shelf, Antarctic Peninsula with (A) backscatter image from Sentinel-1 EW on 27 July 2017 (62) with Inset map for location in Antarctica and the location of the compressive arch of stability of the ice shelf (purple); (B) color-coded 20- (red), 40- (brown), and 100-m (black) contour levels in surface elevation with time-tagged (blue triangles) position of the rupture tip of A68 from Sentinel-1a interferometric SAR; (C) surface elevation above mean sea level (in meters) from TanDEM-X digital elevation model in years 2013 and 2014; (D) zoom-in around GIR; (E) contour levels color coded from 5 to 80 m in 5-m increments; and (F) surface speed (in meters per year) on a logarithmic scale color coded from slow (brown) to fast (blue/red) (63) with grounding line position (red) from ERS-1/2 differential SAR interferometry (64).

