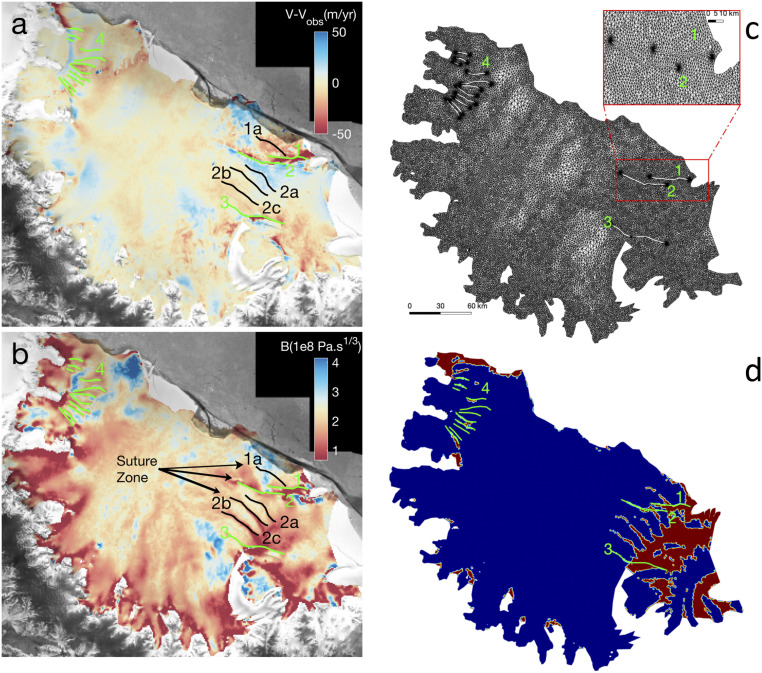
Fig. 2.
(A and B) Model results for Larsen Ice Shelf, Antarctica with (A) misfit between observed and modeled surface velocity (in meters per year) with active (green) and passive (black) rifts (full-thickness cracks) after inversion for (B) ice shelf rheology, B (in Pas1/3) using a control method, with the major rifts labeled 1 to 4 in green (and inactive rifts labeled 1a, 2a, 2b, and 2c in black). (C and D) The finite-element mesh is in C is refined (Inset) around the rupture tips to capture the stress singularities. (D) spatial distribution of ice mélange (red) deduced from the TDX digital elevation model using a threshold 250-m thickness within the active rifts 1 to 4 colored green.

